
Figure 5.
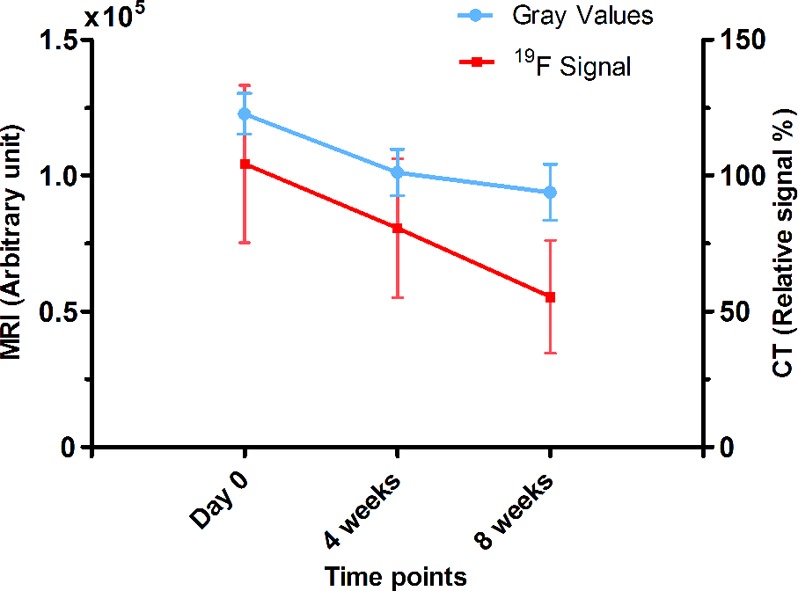
19F MRI and CT signal quantification of the CPC/PFCE/gold composite at day 0, 4 weeks and 8 weeks. 19F signal (red) in 19F ZTE MR images and relative signal (blue) in CT images were quantified and expressed as arbitrary unit and in percentage of relative attenuation intensity, respectively (n = 8). Lines indicate the trend of the data points.