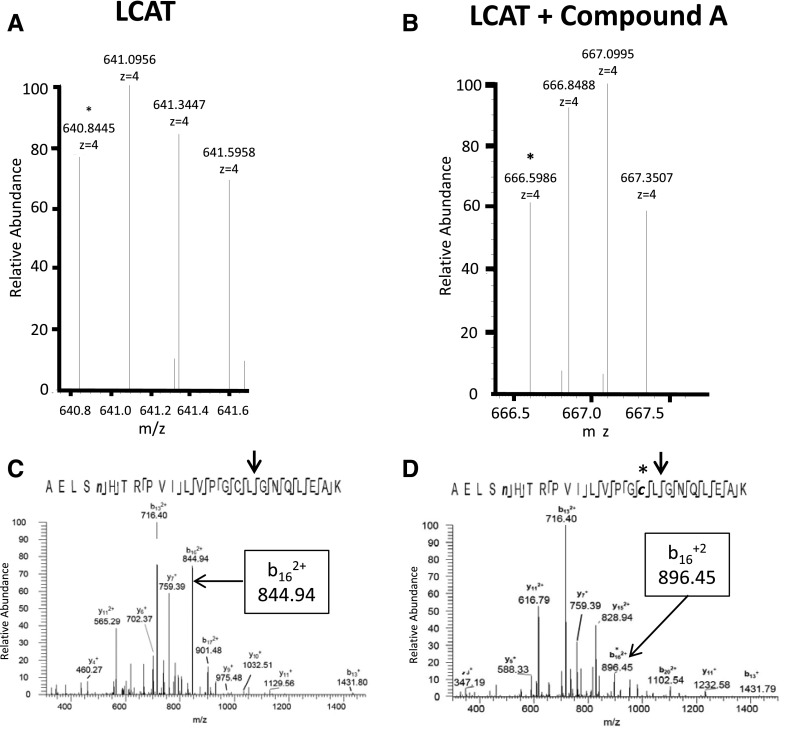
Fig. 8.
MS analysis of LCAT treated with compound A. MS2 spectra of LCAT before (A) and after (B) treatment with compound A. Peaks correspond to precursor ions of the deamidated LCAT peptide AELSnHTRPVILVPGCLGNQLEAK, containing Cys31. The asterisk indicates the monoisotopic peak. (C,D) MS3 spectra produced by collision-induced dissociation of the (M + 4H)4+ precursor ions of the deamidated peptide AELSnHTRPVILVPGCLGNQLEAK, containing Cys31 before (C) and after (D) treatment with compound A. The arrow indicates the fragmentation position of LCAT peptide to produce the b16+2 fragment.

