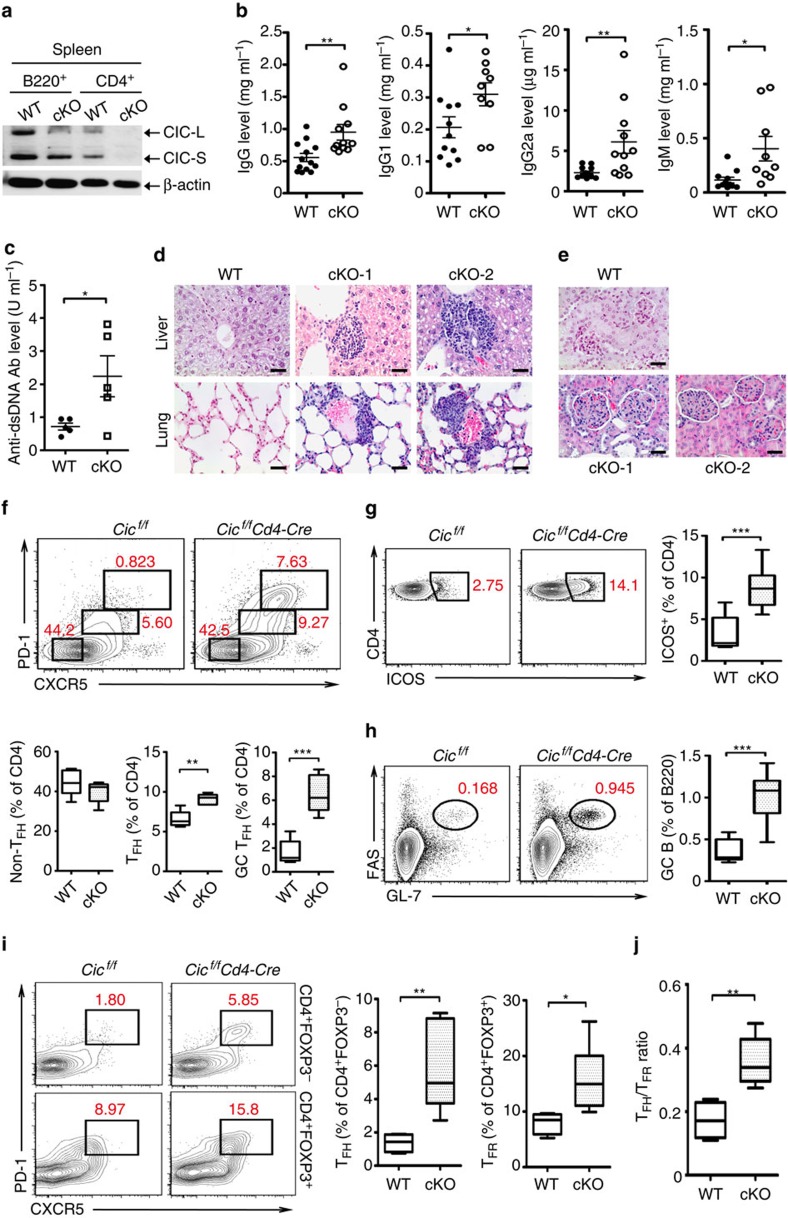
Figure 4. Spontaneous induction of TFH cell differentiation and GC response in T-cell-specific Cic null mice.
(a) Western blot analysis showing T-cell-specific ablation of CIC expression in Cicf/fCd4-Cre mice. B220+ B and CD4+ T cells were purified from spleen of 12-week-old Cicf/f (WT) and Cicf/fCd4-Cre (cKO) mice. (b) Levels of total IgG, IgG1, IgG2a and IgM in sera from 12-week-old Cicf/f and Cicf/fCd4-Cre mice. (c) Serum levels of anti-dsDNA antibody in 14.5-month-old Cicf/f and Cicf/fCd4-Cre mice were measured by ELISA. (b,c) The graphs show data as mean±s.e.m. and each dot in graphs represent an individual mouse. *P<0.05 and **P<0.01 (two-tailed two-sample unequal variance Student t-test). (d) Immune cell infiltration in liver and lung from 14.5-month-old Cicf/fCd4-Cre mice. Tissue sections were stained with H&E. (e) H&E-stained kidney sections showing glomerulonephritis in 14.5-month-old Cicf/fCd4-Cre mice. (d,e) Representative images from two Cicf/fCd4-Cre mice (cKO-1 and cKO-2) are shown. Scale bars, 100 μm. (f–i) Flow cytometry analyses of non-TFH, TFH and GC TFH cells (f), CD4+ICOS+ T cells (g), GC B cells (h) and CD4+FOXP3−PD-1+CXCR5+ TFH and CD4+FOXP3+PD-1+CXCR5+ TFR cells (i) in spleen from 12-week-old Cicf/f and Cicf/fCd4-Cre mice. All data are representative of three independent experiments with n=4–5 mice per group in each experiment. Numbers adjacent to outlined areas indicate per cent of each cell population among splenic CD4+ or B220+ cells. *P<0.05, **P<0.01 and ***P<0.001 (two-tailed two-sample unequal variance Student t-test). (j) Quantification of the ratio TFH/TFR from the experiments as in Fig. 3i. **P<0.01 (two-tailed two-sample unequal variance Student t-test).

