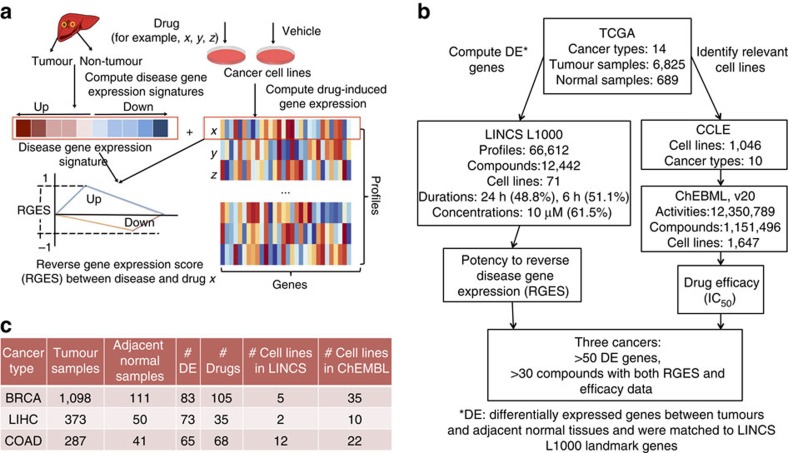
Figure 1. Retrieval of disease and drug gene expression profiles used for RGES computation.
(a) Schematic diagram of computing RGES based on the reversal relationship between disease and drug gene expression profiles. Lower RGES of a drug indicates higher potency to reverse disease gene expression. (b) Workflow of selecting appropriate cancer types to study. The public database TCGA was used to create cancer gene expression signatures; LINCS L1000 was used as the drug signature database; ChEMBL was used as the drug efficacy database; and CCLE was used to map cell lines among databases. Expression of the landmark genes was used by default in this study. The detailed method is described in Supplementary Methods. (c) Statistics of three selected cancers BRCA, LIHC and COAD. TCGA, The Cancer Genome Atlas; LINCS, Library of Integrated Network-based Cellular Signatures; CCLE, Cancer Cell Line Encyclopedia.

