
Figure 3.
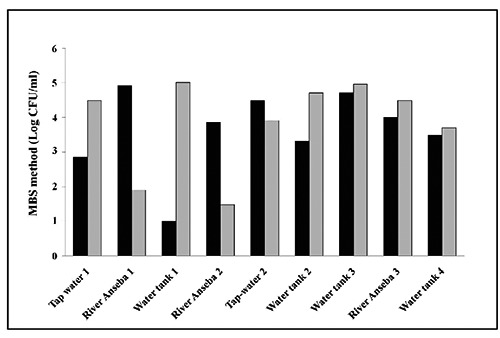
Effectiveness of the treatment with Moringa oleifera. Total Viable Count in Eritrea water samples before and after 1 and 31 hours from the treatment with M. oleifera. The values shown are the means of the results obtained using the Micro Biological Survey method (expressed as log of CFU/mL). For each water sample three independent analyses were performed in duplicate. Black bars show the average of the level of contamination of Total Viable bacteria in the samples before treatment. Grey bars show the average of the level of Total Viable bacteria 1 hour after the treatment with M. oleifera.