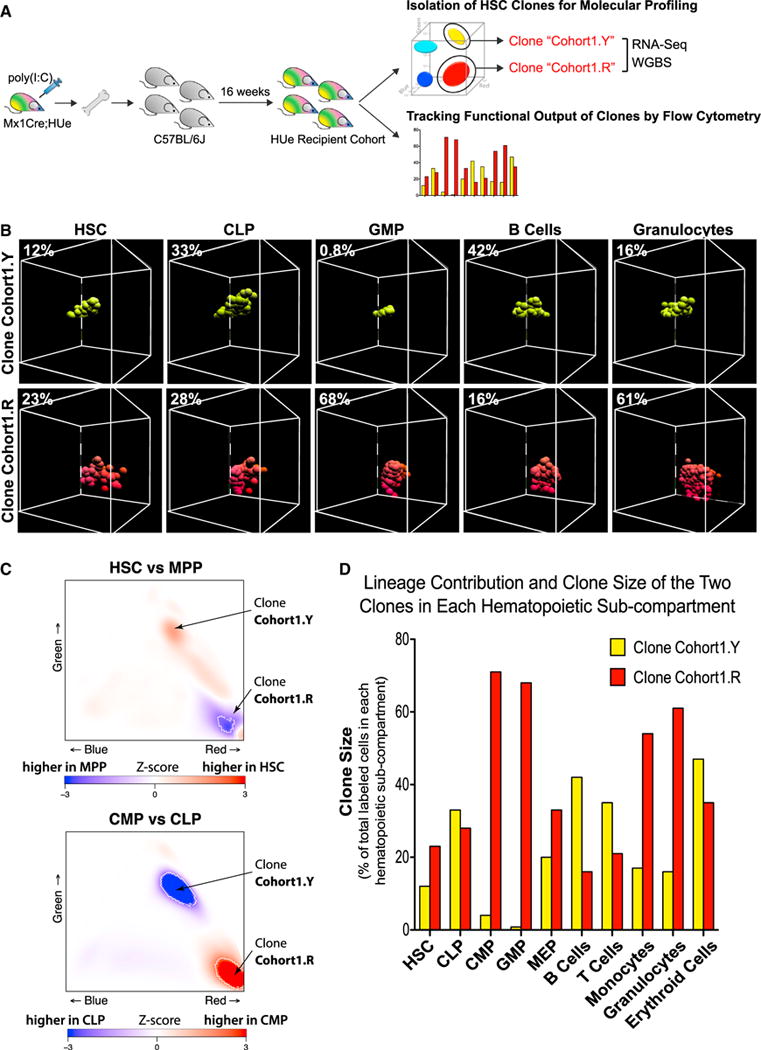
Figure 5. Interrogation of the Molecular Signature Associated with Distinct Functions of HSC Clones.

(A) To examine molecular differences associated with phenotypically distinct HSC clones, LT-HSC cells belonging to two selected clones (Cohort1.Y and Co- hort1.R) were harvested from a HUe recipient cohort, subjected to RNA-seq (transcriptome), WGBS (DNA methylation) assays, and flow cytometric measurement of multi-lineage reconstitution.
(B–D) Both long-term lineage contribution and clone size production of the two select LT-HSC (UneageLoSca+cKit+CD48−CD150+) clones (Cohort1.Y and Cohort1.R) to HSC, MPP, CLP, CMP, GMP, MEP, B cells, T cells, monocytes, granulocytes, and erythroid compartments were measured by flow cytometry (B and D) and analyzed as described in Figure S3. The percentage of cells representing either Cohort1.Y or Cohort1.R among all fluorescent cells in each hematopoietic compartment was shown. The Cohort1.R clone exhibited higher proliferation rate as it increased in size (density of cells) from HSC to MPP compartment (C and D) and was present in all hematopoietic compartments particularly toward myelopoiesis. In contrast, the Cohort1.Y clone showed lower proliferation rate (i.e., decreased clone density from HSC to MPP) and a strong presence in the CLP compartment (C), but reduced production in the CMP, GMP, and downstream myeloid compartments.
See also Figures S6 and S7.
