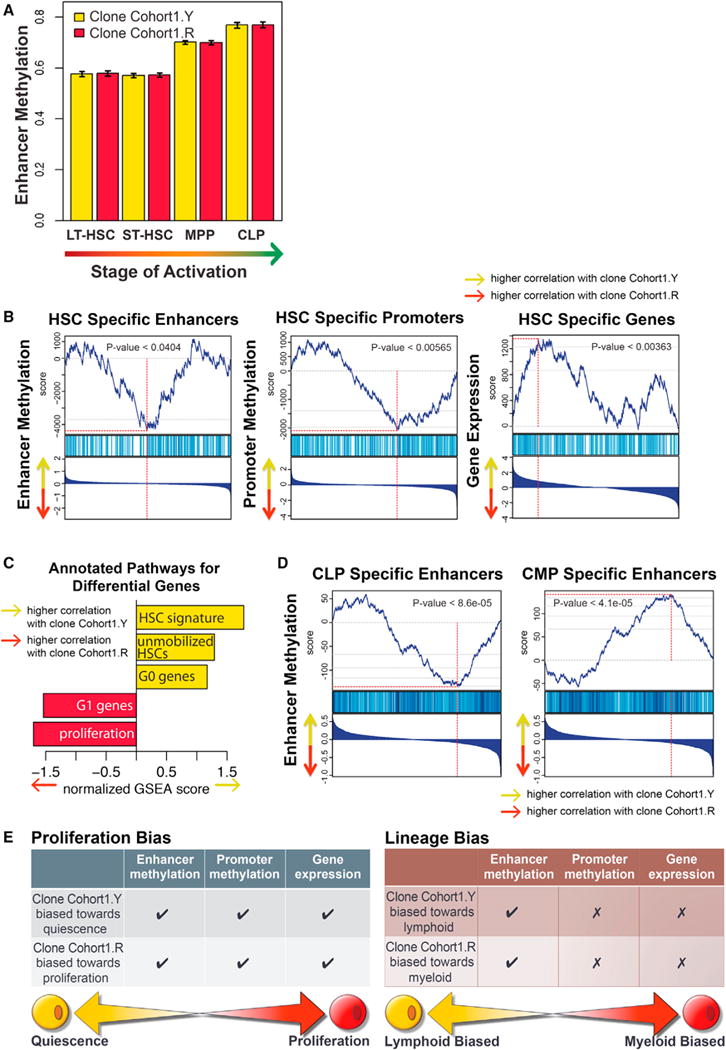
Figure 6. Immunophenotypically Equivalent HSCs Have Distinct Functional Attributes that Are Associated with Distinct Transcriptional and Epigenetic Regulatory States.

(A) The epigenetic state of both Cohort1.Y and Cohort1.R clones matched that expected of the HSCs. The DNA methylation state of enhancers activated at different stages of hematopoiesis was examined in the two clones. Both clones showed equally low methylation levels at the enhancers active at the HSC stage, with higher methylation observed at the enhancer regions activated at later MPP and CLP stages. Whiskers represent 95% confidence interval.
(B) Higher proliferative bias of the Cohort1.R clone was apparent from its epigenetic state. Gene set enrichment analysis (GSEA) analysis showed higher DNA methylation of HSC-specific enhancers and lower methylation of MPP-specific enhancers in the Cohort1.R clone relative to the Cohort1.Y clone. Similarly, Cohort1.R clone showed higher DNA methylation at HSC-specific and lower at MPP-specific promoter regions. Combined with the correspondingly higher expression of MPP- and lower expression of HSC-specific genes in the Cohort1.R clone, all three types of molecular signatures reflect higher proliferative bias of the Cohort1.R clone. In each GSEA plot, the genes (enhancer/promoters) are ranked according to their relative expression (DNA methylation level) ration between Cohort1.Y and Cohort1.R, with the highest Y/R ratios positioned on the left. The top plot shows rank sum statistics with the point of maximum deviation from 0 considered to be the enrichment score of that set (red vertical line). The middle plot marks the positions of the genes (promoters/enhancers) that belong to the set. The bottom plots show log2 fold ratio of expression (DNA methylation) magnitudes between Cohort1.Y and Cohort1.R.
(C) GSEA analysis showed higher expression of proliferation-associated genes and genes associated with G1 phase in the Cohort1.R clone compared to the Cohort1.Y clone, consistent with higher relative contribution of the Cohort1.R clone to the MPP compartment observed in fluorescence data. Higher relative expression of genes associated with unmobilized HSC and G0 phase signature was seen in the Cohort1.Y clone.
(D) Enhancer state reflected lymphoid-specific bias of the Cohort1.Y clone. Consistent with the pronounced lymphoid bias observed for the Cohort1.R clone in fluorescence data, Cohort1.Y clone showed lower DNA methylation at CLP-specific enhancer elements and higher methylation at CMP-specific enhancers relative to the Cohort1.R clone.
(E) Despite both Cohort1.R and Cohort1.Y clones having been immunophenotypically defined as HSCs, molecular profiling of their epigenetic and transcriptional landscape revealed distinctive signatures reflective of their differential functional behavior. Consistent with its larger clone size, the Cohort1.R clone had distinctive DNA methylation pattern at enhancer and promoter regions, as well as transcription of genes indicative of a proliferative cell state. In comparison, the Cohort1.Y clone showed a pronounced lymphoid output and such lineage preference was manifested by lower DNA methylation of lymphoid-specific enhancer regions, while no discernable pattern was detected in terms of promoter methylation or gene transcription.
See also Figures S6 and S7.
