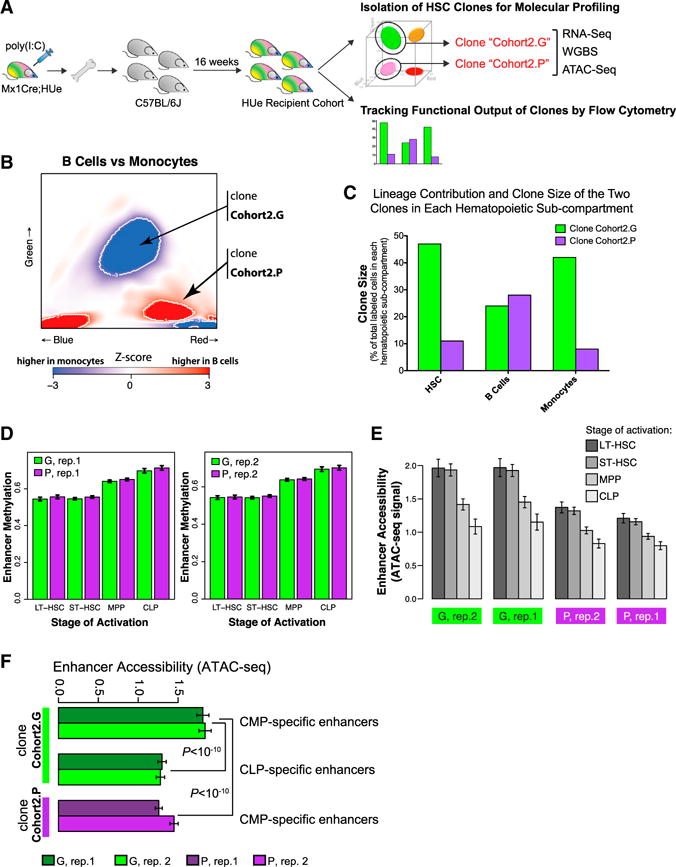
Figure 7. Enhancer Methylation State Reflects Functional Differences between HSC Clones.

(A) In a second independent experiment, LT-HSC cells belonging to two independently selected clones (Cohort2.G and Cohort2.P) were harvested from an independent HUe recipient cohort, subjected to RNA-seq (transcriptome), WGBS (DNA methylation), and ATAC-seq (chromatin accessibility) assays, as well as flow cytometric measurement of clone size and multi-lineage reconstitution.
(B and C) We assessed both long-term lineage contribution and clone size production of the Cohort2.G and Cohort2.P clones toward myeloid (Mac+) and lymphoid (B220+) lineages by flow cytometry. The Cohort2.G clone had increased clone size (density of cells) at the HSC stage (C). While it contributed moderately to lymphoid cells, it had a strong myeloid output (C), consistent with the Z score heatmap indicating statistically significant (p < 10−3) bias of the Cohort2.G clone toward the myeloid lineage (B). In comparison, the Cohort2.P HSC clone was smaller, contributed moderately to lymphoid cells and had reduced production in myeloid cells.
(D) Both clones exhibited chromatin methylation pattern representative of LT-HSC and ST-HSC but not progenitors at the lineage-specific enhancer regions.
(E) Average chromatin accessibility, as measured by the ATAC-seq assay, at the lineage-specific enhancer regions in the Cohort2.G and Cohort2.P clones (two replicate measurements are shown for each clone). Consistent with the DNA methylation results shown in D, ATAC-seq assay indicated highest average accessibility at enhancers associated with LT- and ST-HSC states.
(F) Analogous to (E), Cohort2.G clone showed higher accessibility of the CMP-specific enhancers (relative to CLP-specific enhancers, and relative to the CMP-specific enhancers in the Cohort2.P clone), consistent with the strong myeloid bias observed for the Cohort2.G clone in the flow cytometric measurements.
(D)–(F) Whiskers give 95% confidence interval.
See also Figures S3, S6, and S7 and Table S2.
