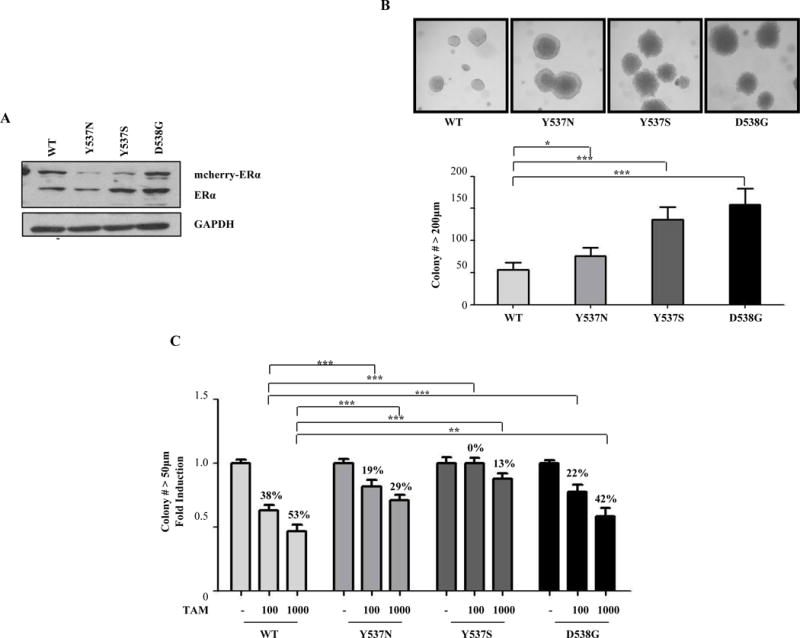
Figure 1. HBD-ESR1 mutations influence Tam response.

a, immunoblot analysis of detect ER expression in MCF-7 stable clones. GAPDH was used as loading control. b, Representative photographs of three different well plates captured from soft agar assays showing higher number of large colonies (200μm) in mutant-expressing cells. Experiments were performed in triplicate and error bars indicate SD. *P<0.05; ***P<0.001. d, Cells were plated for soft agar assays, and then treated with vehicle or two doses of Tam (100nM or 1000nM). Percentage of growth reduction with Tam treatment is shown. Experiments were performed in triplicate and error bars indicate SD. **P<0.01; ***P<0.001.
