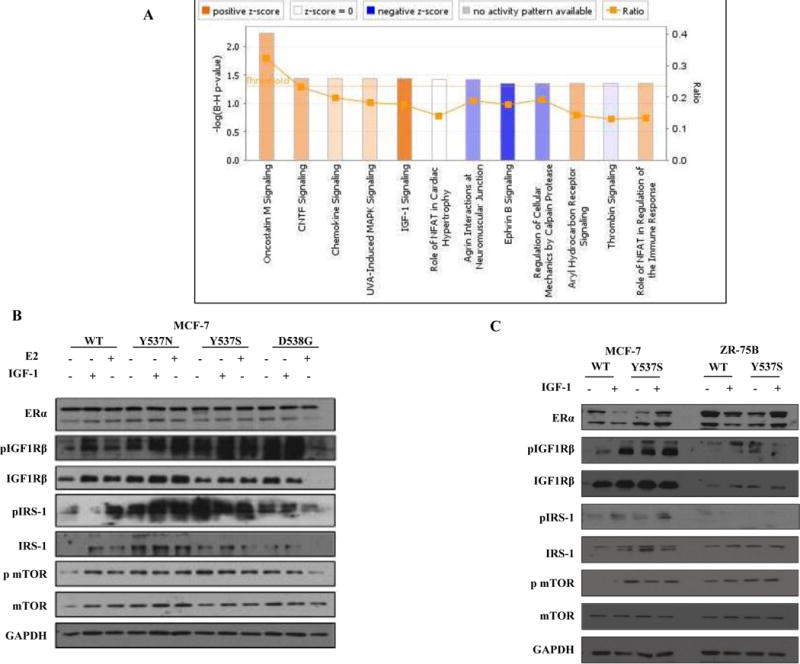
Figure 2. IGF-1 signaling pathway activation in HBD-ESR1 mutants.

a, Ingenuity Pathway Analysis (IPA) to identify activation of signaling pathways in mutant MCF-7 vs. ZR-75B. b, Total cellular extracts were analyzed for phosphorylation and expression of ER, IGF1Rβ, IRS-1, and mTOR; GAPDH was used as a loading control. Immunoblots show a representative example of three experiments. c, Total cellular extracts were analyzed for phosphorylation and expression of ERα, IGF1Rβ, IRS-1, and mTOR; GAPDH was used as a loading control. Immunoblots show a representative example of three experiments.
