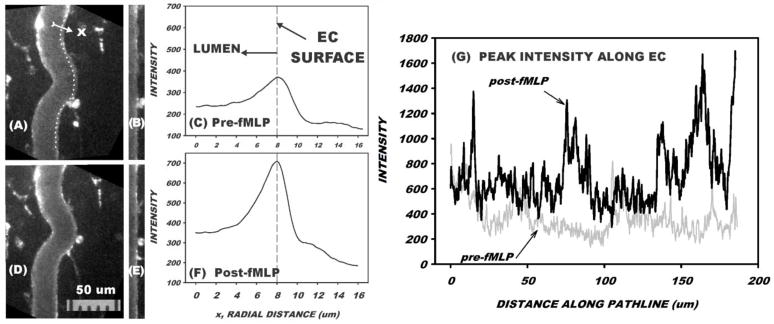
Figure 1.
Illustrative example of measurement of fluorescence of BS-1 lectin on the venular wall prior to superfusion of mesentery with fMLP (A–C) and 10 min following start of fMLP superfusion (D–F). A bolus infusion of LMWH of 1.6 mg/kg was given prior to the measurements. First, a path-line (dotted line in A) was drawn along the luminal edge of the venule and centered on the lectin stain. Second, a radial line normal to and centered on the measurement path was drawn that spanned the wall (16 um in this case). Third, intensity along the radial line was digitized, following which a new radial line was drawn that was centered on the next pixel on the path-line. Panel B shows the matrix of intensities expressed as radial distribution (horizontal) vs location along path-line (vertical). On the order of 1000 radial profiles along the 186 μm path-line were then averaged to obtain the radial profile (C). The distribution of peak intensity along the EC is shown in panel (G), where the average peak intensity increased from 368 ± 136 SD units (C) to 703 ± 240 SD units (F) following 10 min superfusion with fMLP.

