
Figure 1.
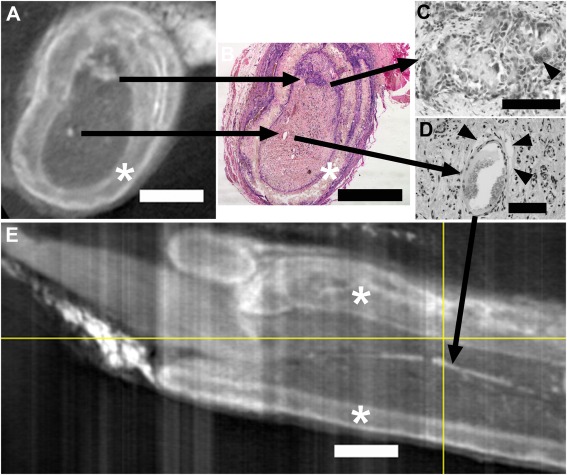
A and E are axial and longitudinal (respectively) micro‐CT images of iodine infused PCL nerve conduits with regenerating tissues. The location of the slice in A is indicated in E by the vertical yellow line (proximal is to the left in E). B, C, and D are images from an H&E stained paraffin section that was matched to the axial view in A. The black arrows starting in A connect micro‐CT structures to their respective structures in B and to higher magnification views in C and D. The uppermost black arrow series illustrates PCL fragments surrounded by and infiltrated with inflammatory cells, including foreign body giant cells (FBGCs, arrowhead in C). The lower black arrow series Illustrates that a high‐density (white) spot in A corresponds to a large blood vessel (B) surrounded by fat deposits (arrowheads in D). This white density marking a blood vessel shows as a white streak running longitudinally within the conduit in E (black arrow). PCL conduit walls are marked by asterisks. Bars equal 1 mm in A, B, and E and 0.1 mm in C and D.