Figure 4.
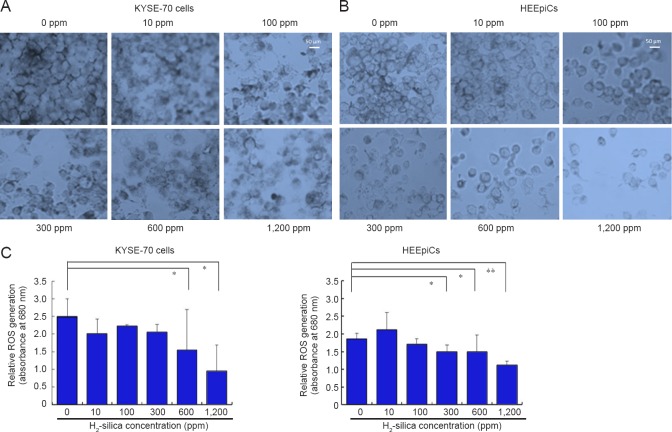
Photomicrographs of KYSE-70 cells and HEEpiCs: NBT assay.
Note: (A) Visualization of NBT staining in KYSE-70 cells (× 400). (B) Visualization of NBT staining in HEEpiCs (× 400). Bars: 50 μm. (C) Quantitative results of intracellular ROS detected by NBT staining in KYSE-70 cells (left) and HEEpiCs (right). There was a tendency for intracellular levels of ROS to decrease with increasing H2-silica concentrations. Data are expressed as the mean ± standard deviation. Student's t-test was used for the statistical analysis. *P < 0.05, **P < 0.01. HEEpiCs: Human esophageal epithelial cells; ROS: reactive oxygen species; NBT: nitroblue tetrazolium.

