
Figure 3(A and B).
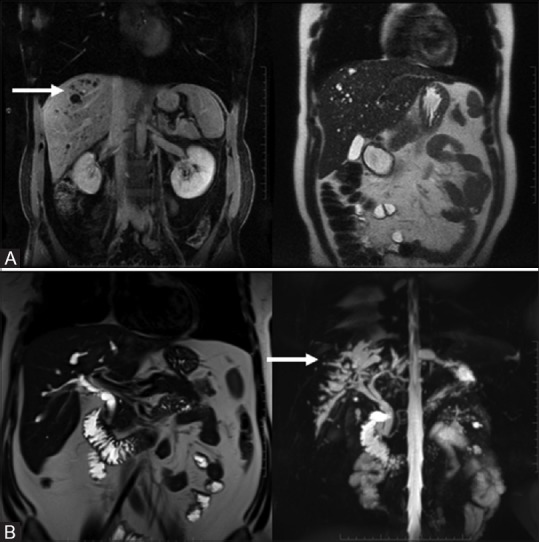
Bile duct hamartomas: fluid attenuating, T2 hyperintense cyst with thin rim enhancement (A, top row). Caroli's disease: showing T2 bright intrahepatic cysts (arrow) in communication with the biliary tree (B, bottom row)
Official websites use .gov
A
.gov website belongs to an official
government organization in the United States.
Secure .gov websites use HTTPS
A lock (
) or https:// means you've safely
connected to the .gov website. Share sensitive
information only on official, secure websites.
Bile duct hamartomas: fluid attenuating, T2 hyperintense cyst with thin rim enhancement (A, top row). Caroli's disease: showing T2 bright intrahepatic cysts (arrow) in communication with the biliary tree (B, bottom row)