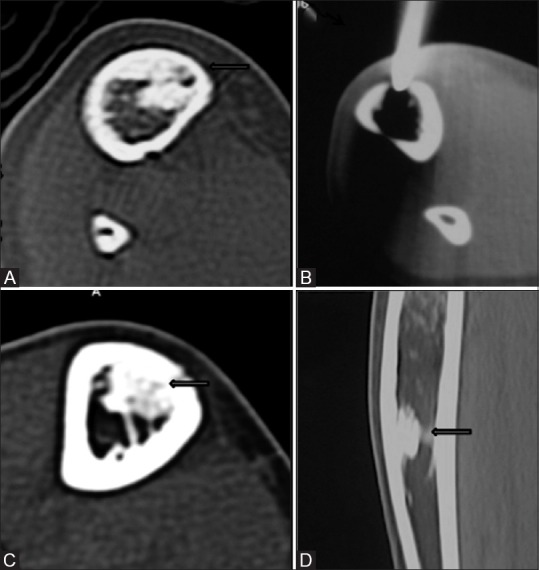
Figure 4(A-D).

Unenhanced axial CT image (A) shows a hypodense nidus (thick arrow) in the anteromedial cortex of right tibia with significant intramedullary sclerosis. Procedural CT image (B) shows the tip of the biopsy needle in the nidus (thin arrow). Axial (C) and sagittal (D) CT images obtained at 6 months follow-up show complete ossification of the nidus (thick arrow)
