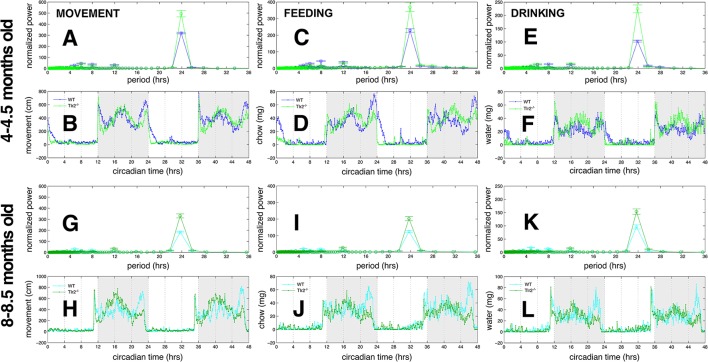
Figure 6.
Tlr2−/− mice have stronger 24-h periodicities compared to WT mice (A). Lomb-Scargle periodogram for movement, 4–4.5 months old mice. WT periodogram in blue, Tlr2−/− periodogram in green (B). Observed movement for WT (blue) and Tlr2−/− (green) cohorts, 4–4.5 months old mice. Thin line with points depicts the mean values for each cohort (C). Lomb-Scargle periodogram for feeding. 4–4.5 months old mice. WT in blue, Tlr2−/− in green (D). Observed feeding for WT (blue) and Tlr2−/− (green) cohorts. 4–4.5 months old mice. (E) Lomb-Scargle periodogram for drinking. 4–4.5 months old mice. WT in blue, Tlr2−/− in green (F). Observed drinking for WT (blue) and Tlr2−/− (green) cohorts. 4–4.5 months old mice. (G) Lomb-Scargle periodogram for movement, 8–8.5 months old mice. WT periodogram in cyan, Tlr2−/− periodogram in dark green (H). Observed movement for WT (cyan) and Tlr2−/− (dark green) cohorts. 8–8.5 month old mice. Thin line with points depicts the mean values for each cohort (I). Lomb-Scargle periodogram for feeding. 8–8.5 months old mice. WT in cyan, Tlr2−/− in dark green (J). Observed feeding for WT (cyan) and Tlr2−/− (dark green) cohorts. 8–8.5 months old mice (K). Lomb-Scargle periodogram for drinking. 8–8.5 months old mice. WT in cyan, Tlr2−/− in dark green (L). Observed drinking for WT (cyan) and Tlr2−/− (dark green) cohorts. 8–8.5 months old mice. For (A,C,E,G,I,K) error bars are ±1 standard deviation. No significant periodicities of longer than 24 h obtained for any behaviors.

