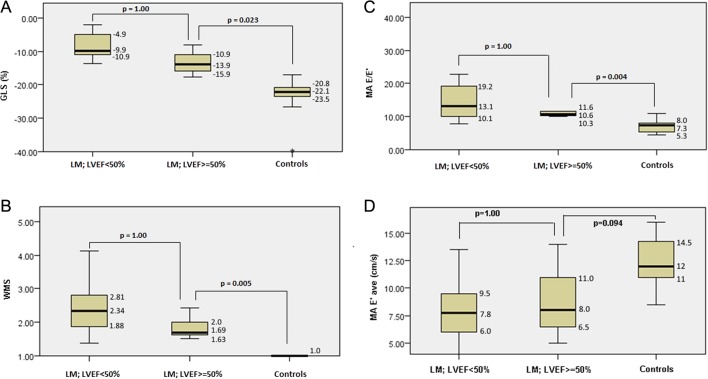
Figure 3.
Box and whisker plots show the comparison between patients who presented with either impaired (LVEF <50%) or preserved left ventricular systolic function (LVEF ≥50%) and normal controls by analysis of variance for GLS (A), WMS (B) and parameters of diastolic function, MA E/E′ (C) and MA E′ave (D). The numeric values reported denote the median (horizontal line of the box) and the inter quartile range (top and bottom line). E′, early diastolic mitral annular velocity, average of lateral and septal measurement; E/E′, ratio of mitral peak velocity of early filling (E) to early diastolic mitral annular velocity (E′); GLS, global longitudinal strain; LM, lupus myocarditis; LVEF, left ventricular ejection fraction; MA, mitral annular; WMS, wall motion score.

 This work is licensed under a