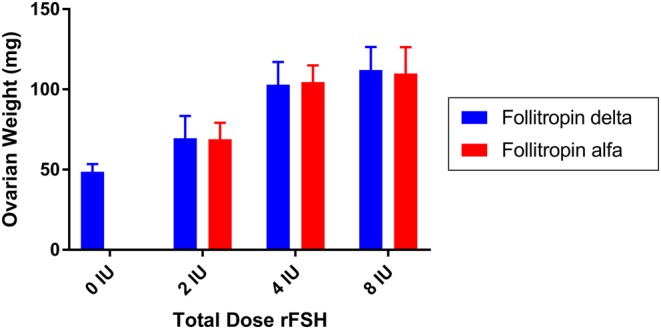
Figure 4.

The bioactivity of follitropin delta (blue bars) and follitropin alfa (red bars) was compared in vivo in rat in the Steelman–Pohley bioassay, measuring the increase in ovarian weight with the administration of the indicated total dose of rFSH proteins. Bars are the mean of 14 animals in each dose group, and error bars are the s.d.

 This work is licensed under a