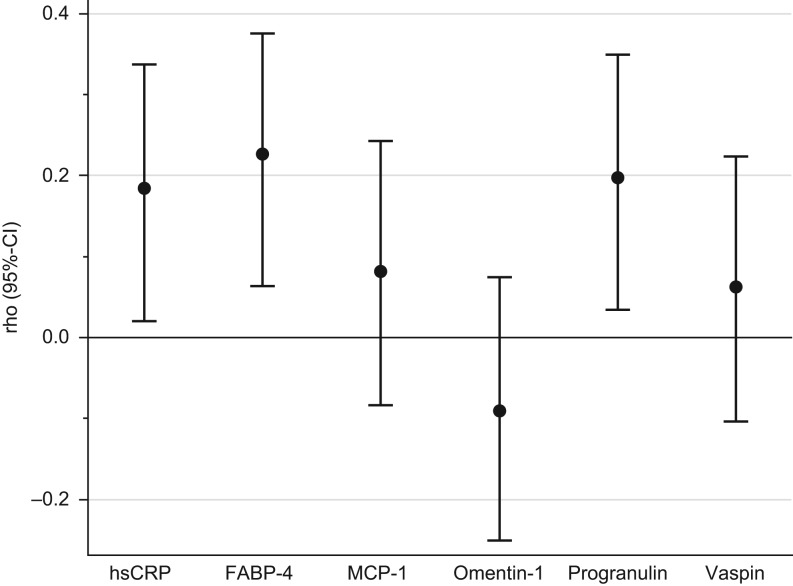
Figure 2.
Spearman correlation coefficients (95% CI) for chemerin with inflammation-related biomarkers adjusted for age, sex, BMI and mutually with remaining biomarkers. Analysis based on n = 151 due to insufficient serum volume for hsCRP measurements. 95% CI calculated using Fisher’s z transformation. FABP-4, fatty acid-binding protein-4; hsCRP, high-sensitivity C-reactive protein; MCP-1, monocyte chemoattractant protein 1.

 This work is licensed under a