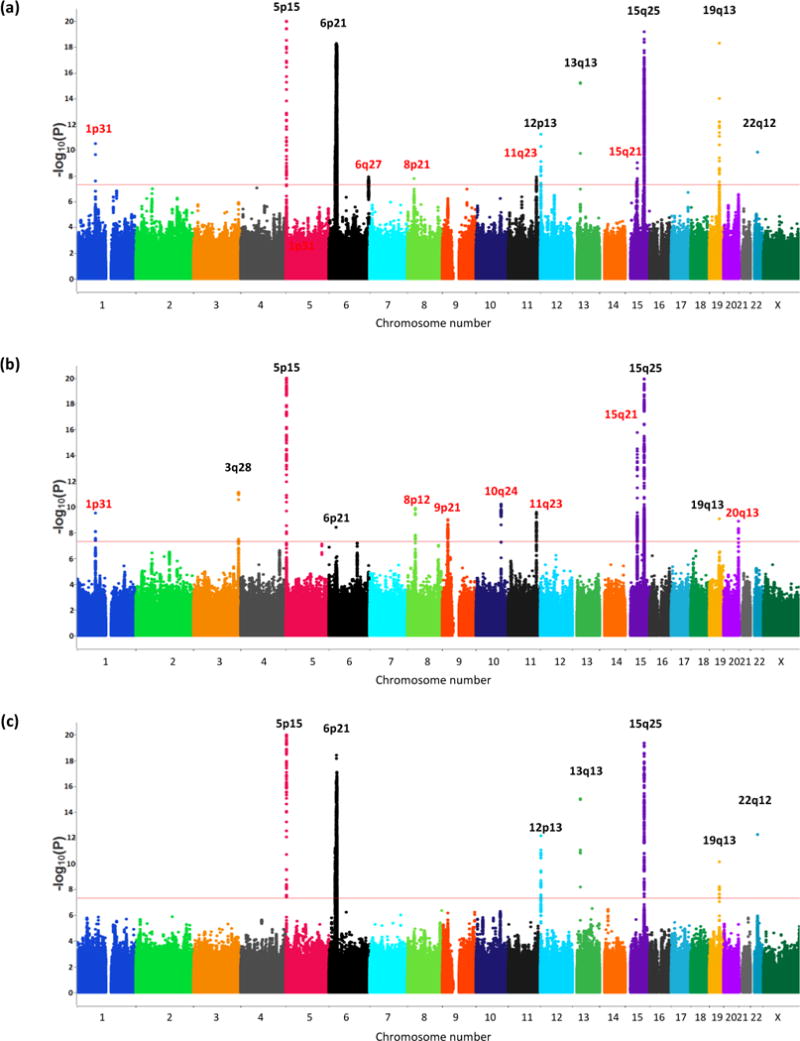
Figure 1. Manhattan plots of lung cancer risk overall and by histological subtypes.

(a) lung cancer risk overall, 29,266 cases and 56,450 controls (b) adenocarcinoma, 11,273 cases and 55,483 controls (c) squamous cell carcinoma 7,426 cases and 55,627 controls. Each locus is annotated by their cytoband locations. The X‐axis represents chromosomal locations and the Y‐axis represents −log10(P‐value). Black denotes the previously known loci and Red denotes the new loci identified in this analysis
