
Figure 6. H31m1-PDL1 cells form progressively growing tumors in WT mice.
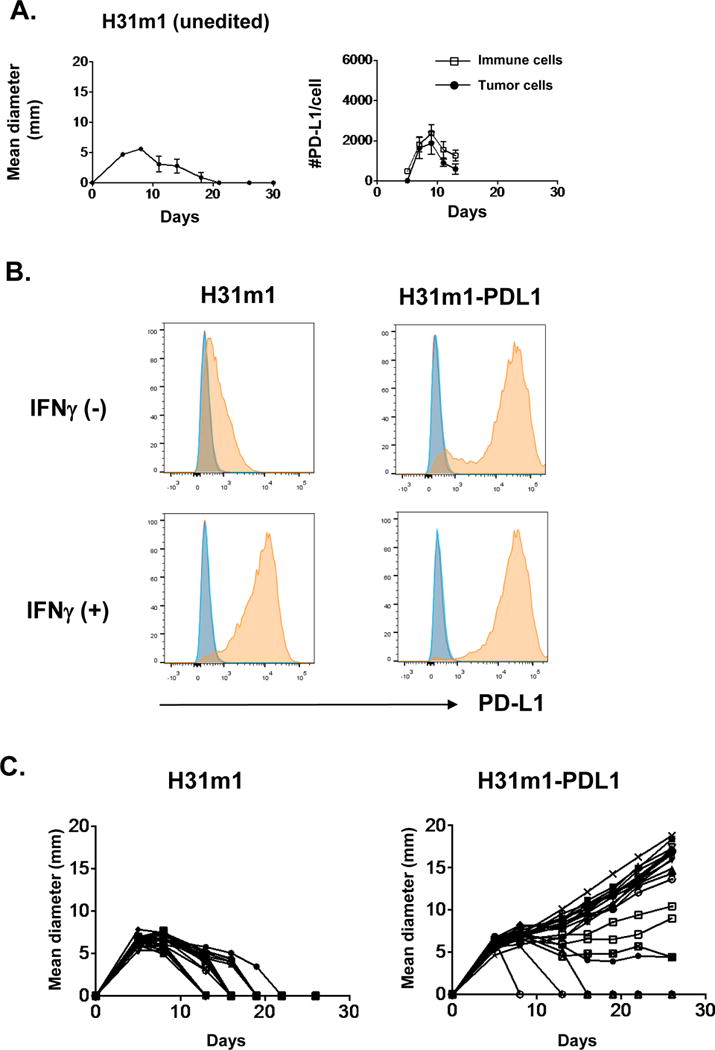
A) Left: In vivo tumor growth of unedited H31m1 MCA sarcoma cells in WT mice. Mice bearing H31m1 cells were left untreated. Data are shown by mean ± s.e.m from at least two independent experiments (n = 5). Right: Numbers of PD-L1 molecules on tumor (CD45−) and immune cells (CD45+) in vivo. Data are shown by mean ± s.e.m from two independent experiments (n = 4). B) In vitro PD-L1 expression on cells treated with or without IFNγ (100 ng ml−1) for 24 h. Data are shown from at least two independent experiments. Red: unstained, blue: isotype control, orange: anti-PD-L1. C) In vivo tumor growth of H31m1 parental and H31m1-PDL1 tumor cells in WT mice. Tumor cells (10 × 106) were injected on day 0. Data shown in this figure is representative of at least two independent experiments (n = 20).