
Figure 7. Host PD-L1 participates in inhibiting immune elimination of T3 sarcoma cells through distinct regulatory machineries.
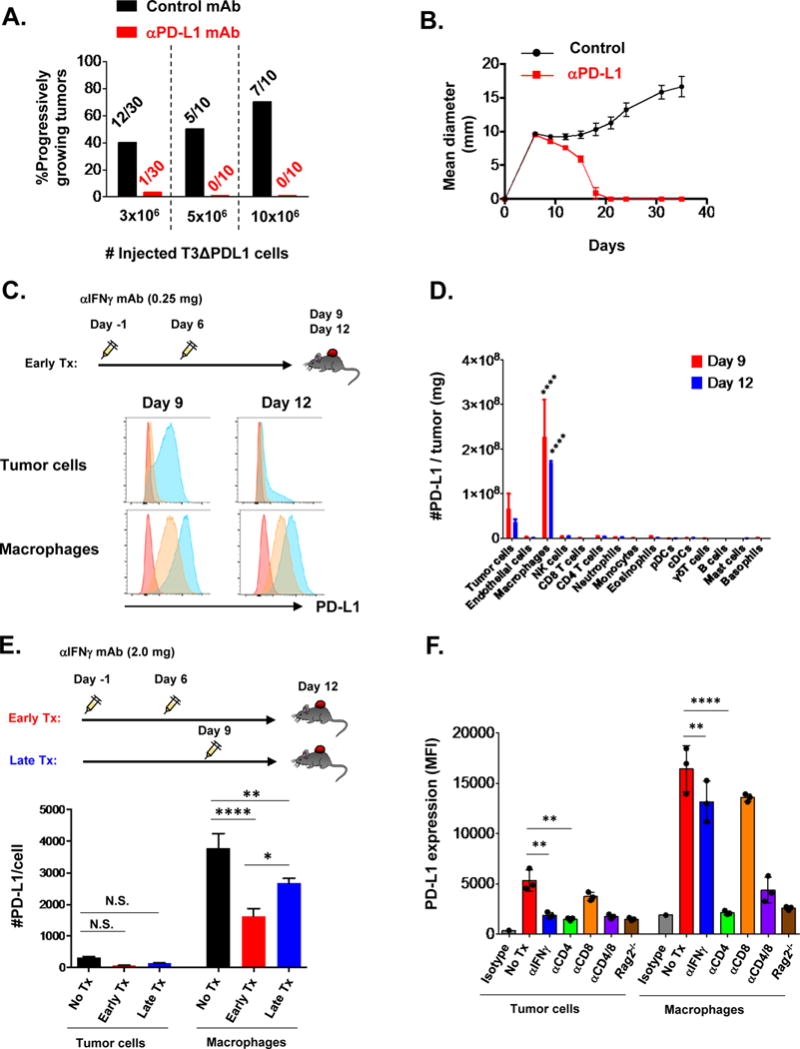
A) Percentage of progressively growing T3ΔPDL1.1 tumors in WT mice treated either with control mAb or anti-PD-L1. Numbers represent mice with progressively growing tumors / all mice injected with the indicated number of tumor cells on day 0. Data are shown from at least two independent experiments. B) Treatment of WT mice with anti-PD-L1 (10F.9G2) leads to rejection of 10 × 106 T3ΔPDL1.1 cells. Data are shown by mean ± s.e.m from two independent experiments (n=5). C) PD-L1 expression on tumor cells and TAMs in T3 tumors on days 9 and 12. Mice were treated with anti-IFNγ neutralizing mAb (0.25 mg/mouse) on days -1 and 6, and injected with T3 sarcoma cells on day 0. Red: isotype, blue: untreated mice, orange: mice treated with anti-IFNγ. Data are shown from three independent experiments. D) Absolute numbers of PD-L1 molecules expressed on cell types in pooled three T3 tumors on days 9 and 12. Data are shown by mean ± s.e.m from three independent experiments (n = 3). E) A large proportion of PD-L1 molecules on TAMs are IFNγ independent. Mice were treated with anti-IFNγ neutralizing mAb (2.0 mg/mouse) either on days -1 and 6, or on day 9, and injected with T3 sarcoma cells on day 0. PD-L1 expression on tumor cells and TAMs was analyzed on day 12. Data are shown by mean ± s.e.m from three independent experiments (n = 6). F) CD4+ T cells contribute to PD-L1 expression on TAMs in the absence of IFNγ. F244 sarcoma cells were injected into either WT or Rag2−/− mice. WT Mice were left untreated or treated with anti-IFNγ neutralizing mAb, anti-CD4 mAb, anti-CD8 mAb, or the combination. PD-L1 expression on tumor cells and macrophages in the tumors was analyzed on day 8. Data are shown by mean ± s.e.m from at least two independent experiments (n = 3). Data in D, E, F were compared using one-way ANOVA followed by multiple comparison test. N.S., not significant; ****P < 0.0001, **P < 0.01, *P < 0.05.