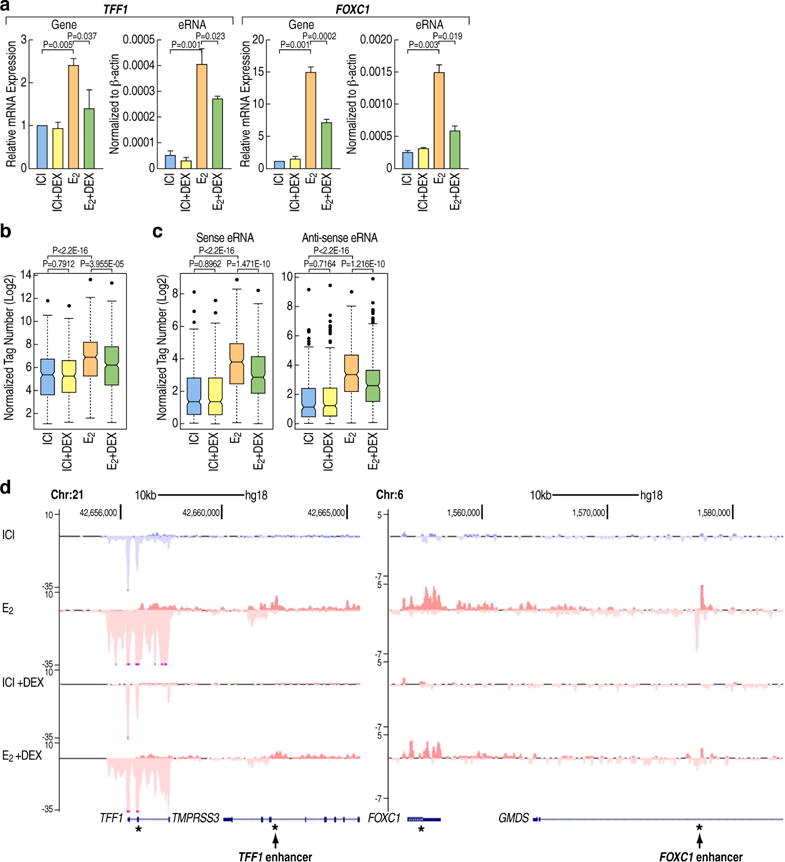
Figure 1. Dex significantly repress the E2-mediated activation of target genes and enhancers.

(A). E2+Dex treatment of MCF7 cells significantly represses E2-activated genes (TFF1, FOXC1) and eRNAs expression. qRT-PCR results are presented as mean ± SD. N≥3, two-tailed Student’s t test.
(B). Boxplot showing normalized GRO-seq tags (Log2) for E2-induced genes under different treatment conditions (ICI, ICI+DEX, E2, E2+Dex) in MCF7 cells. (P value is calculated by Wilcoxon rank sum test)
(C). Boxplots showing normalized GRO-seq tags (Log2) for eRNAs transcribed at active enhancers under different treatment conditions (ICI, ICI+DEX, E2, E2+Dex) in MCF7 cells. Sense and antisense eRNA transcripts are shown separately. (P value is calculated by Wilcoxon rank sum test).
(D) Genome browser image showing normalized GRO-seq tag counts in MCF7 cells under different ligands treatment (ICI, ICI+DEX, E2, E2+Dex). TFF1 and FOXC1 loci are shown. “*” indicates the position of primers used for qPCR detection. See also Figure S1
