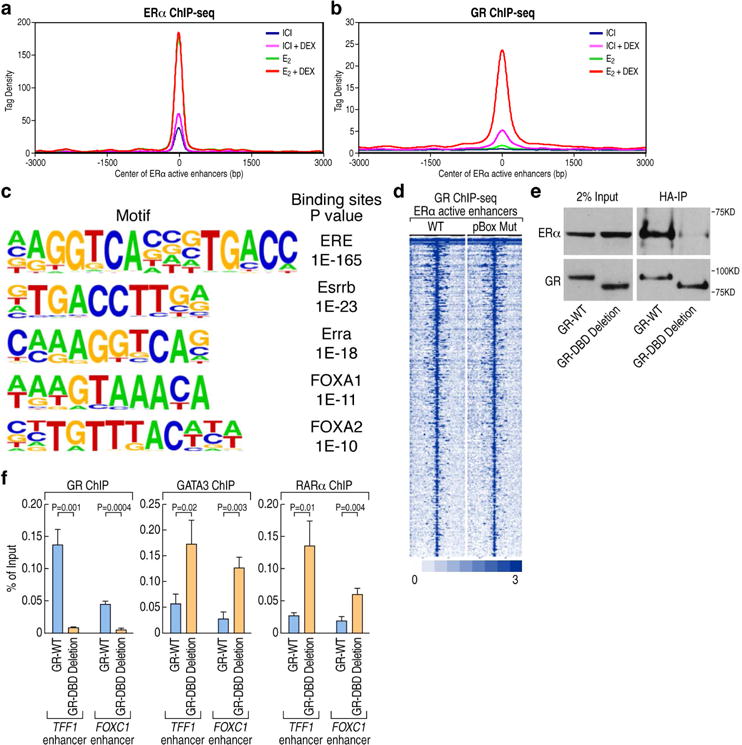
Figure 2. GR is recruited in trans on the E2-activated enhancers following E2+Dex treatment.

(A). ChIP-seq tag density profile plot showing ERα binding on 423 ERα-activated enhancers upon different ligands treatment (ICI, ICI+DEX, E2, E2+Dex). The center of the plot is based on the center of ERα binding.
(B). ChIP-seq tag density profile plot showing the binding of GR to 423 ERα-activated enhancers with different ligands treatment (ICI, ICI+DEX, E2, E2+Dex). The center of the plot is based on the center of ERα binding.
(C) De novo motif analysis of GR binding sites based on the 423 ERα-activated enhancers.
(D) Heatmaps of ChIP-seq tag counts for 423 ERα-activated enhancers occupied by GR wild type or pBox mutant in MCF7 cells treated with E2+Dex.
(E) The interaction of GR with ERα is dependent on its DNA-binding domain (DBD), as shown by coimmunoprecipitation using HA-tagged WT or DBD deleted-GR.
(F) ChIP-qPCR showing GR, GATA3 and RARα binding on ERα-activated enhancers (TFF1 and FOXC1 enhancers) in GR wild type and GR DBD deletion stable MCF7 cells upon E2+Dex treatment. Data are presented as mean ± SD. N≥3, two-tailed Student’s t test. See also Figure S2
