
Figure 4. Activity-dependent activation of the Bax/Bak-Caspase pathway in descending CS axons.
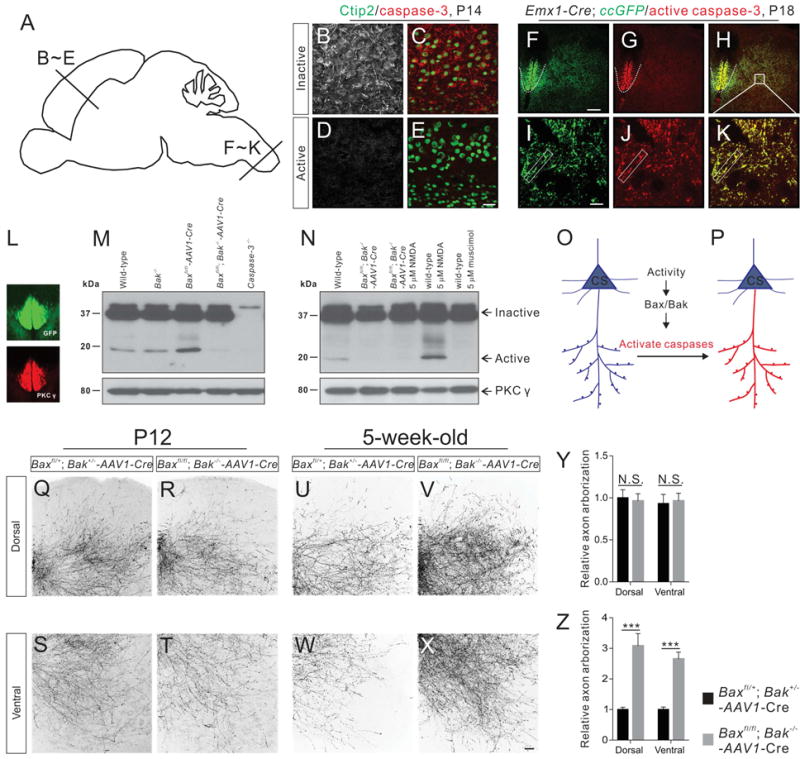
(A) Sagittal view of the mouse brain showing section locations of images shown in panels B–E.
(B–E)Immunofluorescent labeling of P14 motor cortex sections using antibodies targeting the inactive and active forms of caspase-3 (red) or Ctip2 (green). The inactive form of caspase-3 (B and C) but not active caspase-3 (D and E) was expressed in the soma of CS neurons. Sections are taken from the motor cortex as shown in A.
(F–K) Immunofluorescent labeling of P18 cervical spinal cord sections of Emx1-Cre; ccGFP mice using antibodies against GFP (green) and the active form of caspase-3 (red). Selective activation of caspase-3 was observed in GFP+ CS axons in the dorsal funiculus (indicated by white dashed lines in F–H) and CS axon collaterals in the gray matter (indicated by rectangular white boxes in I–K).
(L) Immunostaining for PKCγ in a P14 cervical spinal cord showing the selective expression of PKCγ in GFP+ CS axons.
(M and N) Western blot analyses of protein lysates from the cervical dorsal funiculus of P14 mice using antibodies against full-length (inactive) caspase-3 and PKCγ. (M) Protein lysates from P14 wild-type, Bak−/−, Baxfl/fl-AAV1-Cre, Baxfl/fl; Bak−/−-AAV1-Cre, and caspase-3−/− mice. (N) Protein lysates from wild-type mice, Baxfl/fl; Bak−/−-AAV1-Cre, Baxfl/fl; Bak−/−-AAV1-Cre mice treated with NMDA (5 μM, 2 hours), wild-type mice treated with NMDA (5 μM, 2 hours), and wild-type mice treated with muscimol (5 μM, 2 hours).
(O and P) Diagram of caspase-3 activation in CS neurons. The inactive form of caspase-3 (blue) is present in CS neurons but its activation (red) is selectively restricted to descending axons and their collaterals.
(Q–X) Representative images of cervical spinal cords showing GFP+ CS axon collaterals from P12 and 5-week-old adult Baxfl/+; Bak+/− (control, Q, S, U, and W) and Baxfl/fl; Bak−/− (R, T, V, and X) mice.
(Y and Z) Comparison of levels of axon arborization in Bax/Bak double-mutant and control mice. CS axon collaterals in Bax/Bak double-mutant mice (n=8) are similar (dorsal, P=0.7880; ventral, P=0.8214) to that of control mice (n=8) at P12 (Y). Levels of axon arborization in adult Bax/Bak double-mutant mice (n=8) are significantly (dorsal, P<0.0001; ventral, P=0.0001) higher than that of control mice (n=8). Where “n” represents the number of mice used in each experiment. Scale bars, 10 μm (I), 30 μm (E), 50 μm (X), and 100 μm (F). See also Figures S4 and S5.