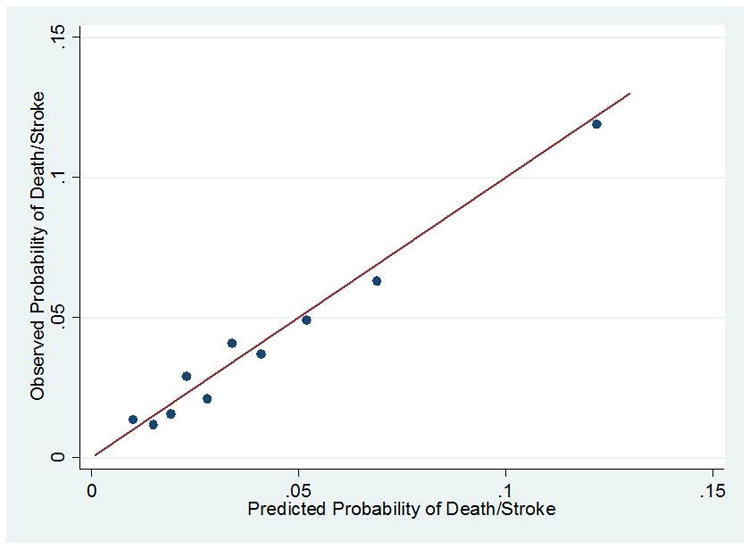
Figure 1.

Observed versus predicted probability of death or stroke within 30 days with the full model over 100 bootstrapped samples. Individuals are grouped into 10 deciles based on their predicted probability of death or stroke in 30 days. Displayed line is y=x.
