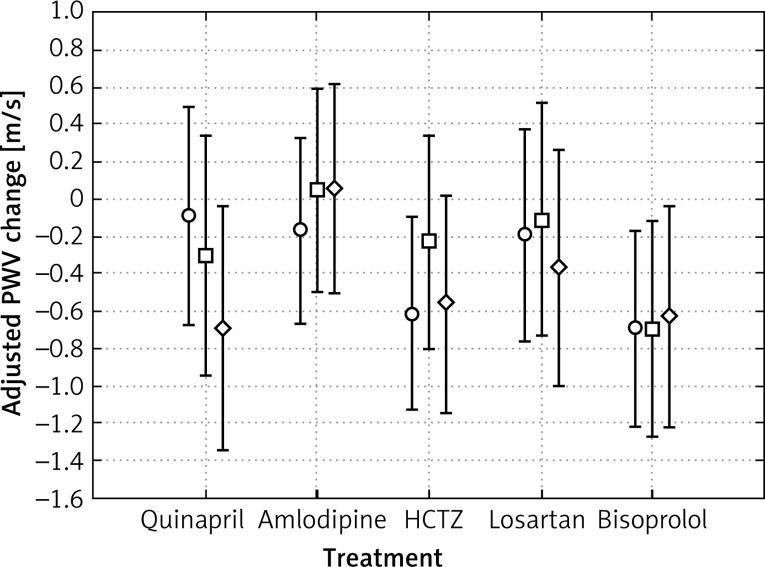
Figure 1.
Changes from baseline to final visit in carotid-femoral pulse wave velocity (in patients randomized to therapeutic subgroups (ANCOVA analysis)). Adjusted for age, gender, baseline PWV, systolic blood pressure, and reduction in SBP changes from baseline in mean PWV at visit 2 (○), 3 (□) and 4 (◊). Error bars show SEM. P >= 0.5179 for between treatment group difference

