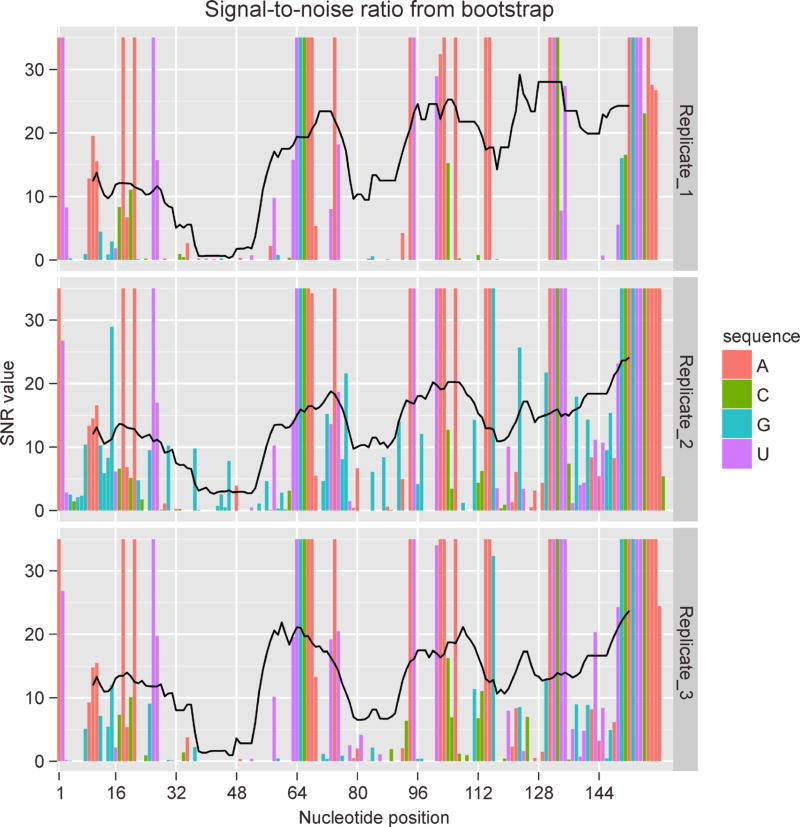
Figure 2. Quality screening with SEQualyzer.
Bars represent per-nucleotide SNR and black lines represent rolling mean of per-nucleotide SNR for windows of 20 nt. SEQualyzer estimates SNR via bootstrap as described by Choudhary et al. [59]. Examination of quality profiles reveals that signal quality is good for entire RNA except a short region from nucleotides 35–53 where it is poor in all replicates. For illustration purpose, we used data for P4 – P6 domain of Tetrahymena group I intron ribozyme from Loughrey et al. [33].

