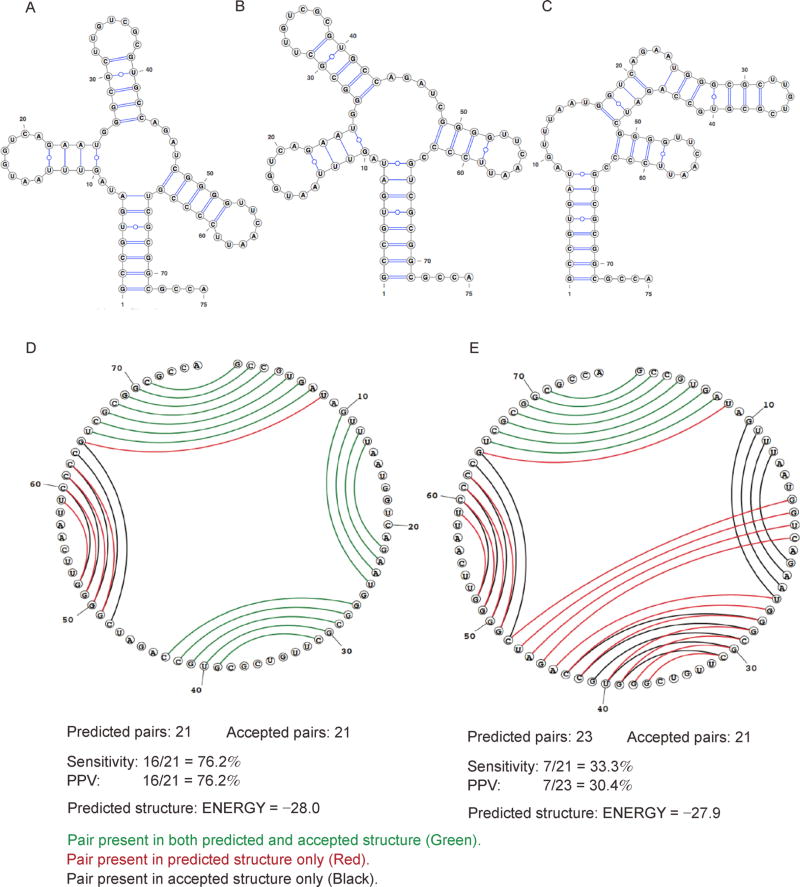
Figure 3. Comparison between MFE secondary structure and one of the suboptimal secondary structures for tRNA (asp), yeast.
(A) Reference (accepted) structure. (B) MFE structure. (C) Suboptimal structure. (D) Circular plot comparing the MFE structure in B to the reference structure in A. (E) Circular plot comparing the suboptimal structure in (C) to the reference structure in (A). Structures are predicted using the Fold program in RNAstructure package [125] with default parameters. Plots (A), (B) and (C) are prepared with VARNA [134]. Circular plots (D) and (E) are prepared with the CircleCompare program in RNAstructure. In (D) and (E), base pairs are indicated by lines. Pairs present in both the predicted and reference structures are in green; pairs which are present only in the predicted structure are in red; and pairs which are present only in the reference structure are in black.

