
Figure 4.
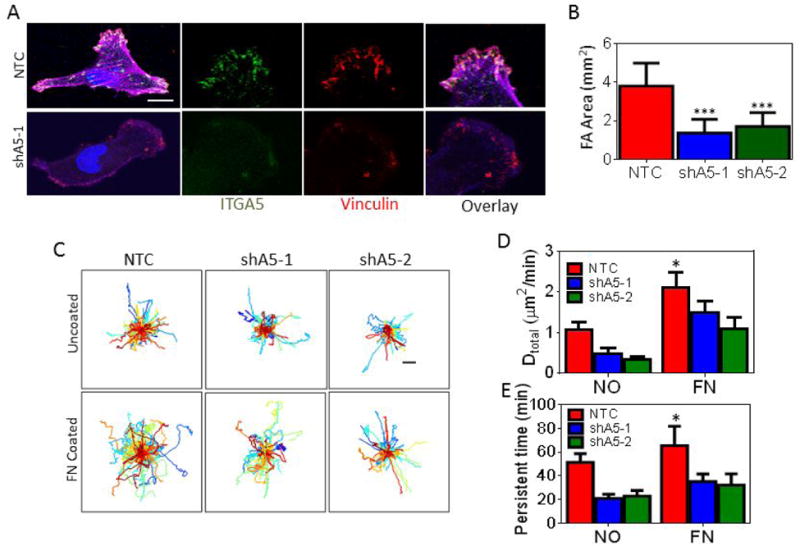
Inhibition of ITGA5 expression affects cell motility in 2D. A, Non-targeting control (NTC) or ITGA5-knockdown (shA5-1 and shA5-2) MDA-MB-231 subclones were labeled with antibodies against ITGA5 (green) and vinculin (red), and stained with DAPI (blue) followed by fluorescence imaging. Scale bar = 10 μm. B, The focal adhesion (FA) area (vinculin staining) was measured using image analysis and normalized by cell area. Data are shown as mean ± SEM; n = 15-30 cells. ***P < 0.001 vs. NTC (two-way ANOVA with Bonferroni posttest). C, Cell trajectories (n = 75-100) are plotted using x,y coordinates obtained at 5-min intervals over a 13-h time course. Scale bar = 40 μm. D-E, The diffusivity (D) and persistent time (E) of subclones migrating on uncoated or fibronectin-coated plates were calculated. Data are shown as mean ± SEM; n = 75-100. *P < 0.05 vs. NTC (two-way ANOVA with Bonferroni posttest for all comparisons).