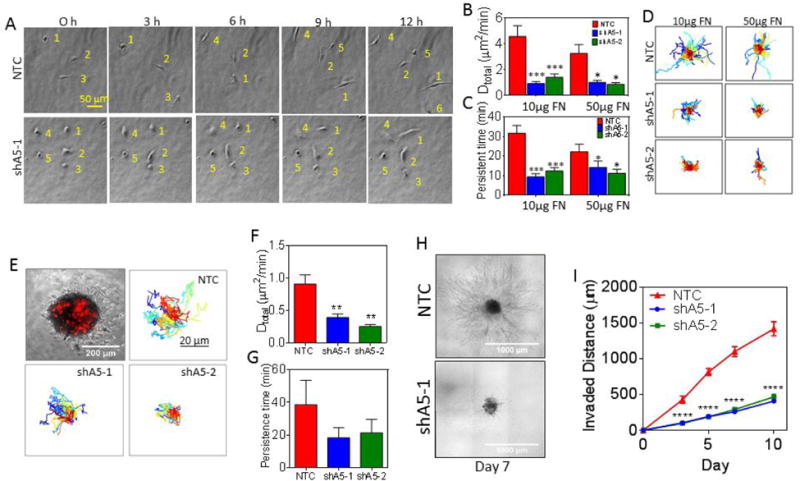
Figure 5.

Knockdown of ITGA5 affects 3D cell motility both as single cells and cells in a multicellular spheroid. A, Representative images at 3-h time intervals of cells migrating in a collagen/fibronectin gel. Each cell is numbered to aid visualization. B-C, The diffusivity (B) and persistent time (C) were determined for subclones embedded in 3D collagen gels containing 10 or 50 μg/mL of fibronectin (FN). Data are shown as mean ± SEM; n = 50. ***P < 0.001, **P < 0.01, *P < 0.05 vs. NTC (two-way ANOVA with Bonferroni posttest for all comparisons). D, Cell trajectories (n = 75-100) are plotted using x,y coordinates obtained at 5-min intervals over a 13-h time course. E, Spheroids containing 1,000 NTC, shA5-1, or shA5-2 cells labeled with a red fluorescent carbocyanine tracer were mixed with 9,000 non-labelled naive cells and embedded into collagen gels containing 50 μg/mL of fibronectin (top left corner). Cell trajectories (n = 40) are plotted using x,y coordinates obtained at 20-min intervals over a 15-h time course. Scale bar = 20 μm. F-G, The diffusivity (F) and persistent time (G) of subclones migrating within spheroids were calculated. Data are shown as mean ± SEM; n = 40. **P < 0.01 vs. NTC (one-way ANOVA with Bonferroni posttest for all comparisons). H-I, The invasion of tumor spheroids composed of 10,000 NTC, shA5-1 or shA5-2 cells into collagen gels were imaged by phase contrast (H) and the invaded distance measured on day 0, 3, 5, 7 and 10 to examine 3D invasion was plotted (I) for comparison. Data are shown as mean ± SEM; n = 10 spheroids. ***P < 0.001, *P < 0.05 vs. NTC (two-way ANOVA with Bonferroni posttest).
