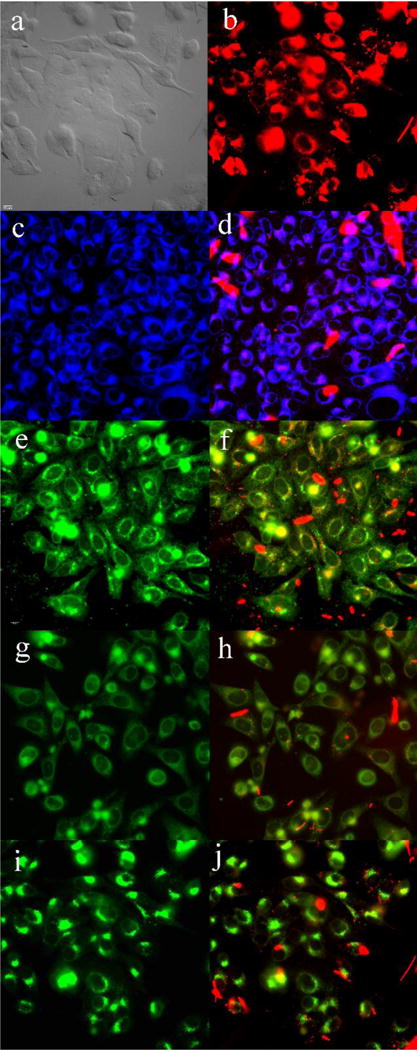
Figure 10.

Subcellular localization of 8 in HEp2 cells at 10 μM for 6 h. (a) phase contrast, (b) overlay of 8 and phase contrast, (c) ER Tracker Blue/White, (d) overlay of 8 and ER Tracker, (e) BODIPY Ceramide, (f) overlay of 8 and BODIPY Ceramide, (g) MitoTracker Green, (h) overlay of 8 and MitoTracker, (i) LysoSensor Green, (j) overlay of 8 and LysoSensor Green. Scale bar: 10 μm.
