
Figure 7.
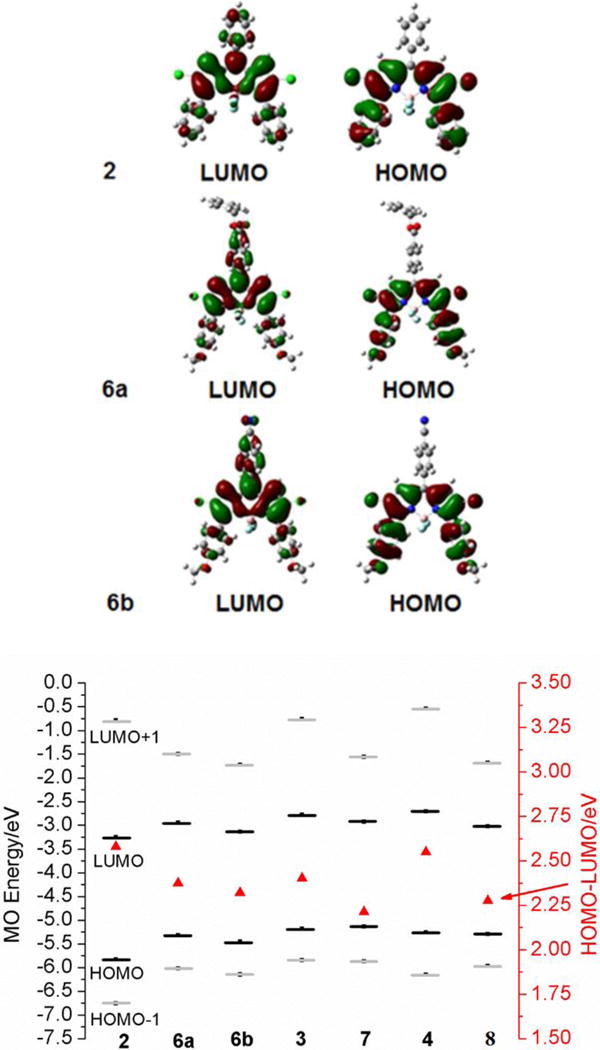
DFT calculated frontier orbitals for BODIPY 2, 6a and 6b (upper) and molecular orbital energies for BODIPYs. The HOMO-LUMO gaps are plotted against a secondary axis and are denoted by red triangles (bottom).
Official websites use .gov
A
.gov website belongs to an official
government organization in the United States.
Secure .gov websites use HTTPS
A lock (
) or https:// means you've safely
connected to the .gov website. Share sensitive
information only on official, secure websites.
DFT calculated frontier orbitals for BODIPY 2, 6a and 6b (upper) and molecular orbital energies for BODIPYs. The HOMO-LUMO gaps are plotted against a secondary axis and are denoted by red triangles (bottom).