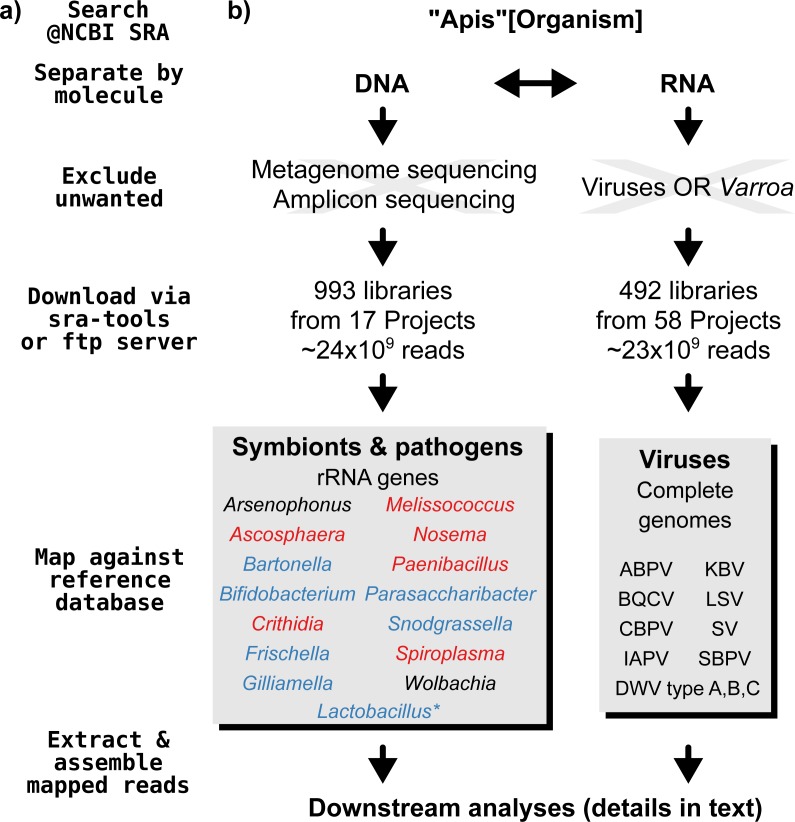
Figure 1. Outline of screening procedure employed in this study.
(A) Computational steps involved in screening. (B) Details for each of the steps. For the ‘symbionts & pathogens’ database, microbial taxa are color-coded as follows: red–pathogens, blue–gut symbionts, black–environmental/opportunistic symbionts. A second, more detailed screen was performed for Lactobacillus symbionts only (marked with an asterisk, for details see ‘Materials & Methods’). A detailed guide to replicate our analyses can be found under https://github.com/gerthmicha/symbiont-sra.

