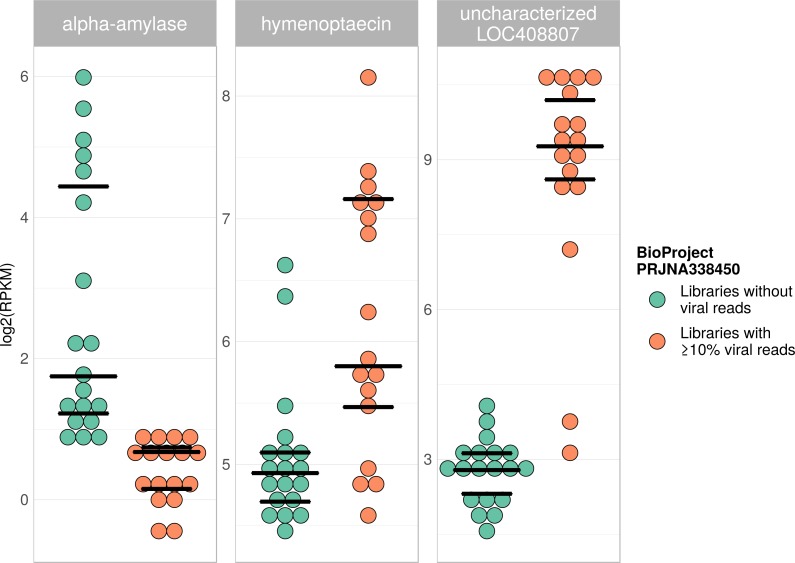
Figure 7. Example of differentially expressed honey bee genes in response to viral infection.
The relative expression levels of three genes that were determined to be significantly differentially expressed with respect to viral infection status are plotted for one project. Each library is represented by one dot, and lines correspond to 75% quartile, median, and 25% quartile of all samples of a group, respectively. Expression levels for all investigated genes and projects can be found in Figs. S2–S5 and Table S5.

