Abstract
Introduction
Variation in treatment and survival outcomes for Non–Small Cell Lung Cancer (NSCLC) is high among patients with stage III or IV, but untreated NSCLC patients have not been critically analyzed to evaluate for improvable outcomes. We evaluated treatment trends and their association with oncologic outcomes for NSCLC, hypothesizing that there are a substantial number of untreated patients who are similar to patients who undergo treatment.
Methods
Linear regression was used to calculate trends in utilization of treatment. Kaplan-Meier and Cox regression modeling were used to determine predictors of receiving treatment. Propensity-matching was used to compare survival among subsets of treated versus untreated patients.
Results
Patients with primary NSCLC were identified from the National Cancer Data base from 1998–2012 and 21% (190,539) of patients received no treatment. For stage IIIA and IV, the proportion of untreated patients increased over the study period by 0.21% and 0.4% respectively (p= 0.003, <0.0001). Regardless of stage, untreated patients had significantly shorter OS (p<0.0001). Propensity-matched analyses of 6,144 stage IIIA patient pairs treated with chemoradiation vs no treatment confirmed shorter OS for untreated patients (Median, 16.5 vs 6.1 months, p <0.0001). For 19,046 stage IV patient pairs treated with chemotherapy vs no treatment, similar results were obtained (Median OS, 9.3 vs 2.0 months, p<0.0001).
Conclusions
The proportion of untreated stage IIIA and IV patients is increasing. Survival outcomes among advanced stage patients are superior with treatment, independent of selection bias. The benefits and risks of treatment should be carefully assessed prior to choosing to forego treatment.
Introduction
Non-small cell lung cancer (NSCLC) is the number one cause of cancer-related death in the US, with an estimated 158,080 deaths in 2016.1 Despite the introduction of new systemic treatment approaches, 5-year survival remains dismal at approximately 17%.2 Despite changing demographics, such as greater numbers of women who are younger and who have better performance status patients and improvements in systemic therapies and clinical trial enrollment, overall survival rates have changed slowly and incrementally.3
The National Cancer Care Network releases updated guidelines annually for the evaluation and management of NSCLC, and standard therapy regimens are based on stage.4 For patients with stage I and II disease, local therapy with surgery or radiation is recommended depending on medical operability. In contrast, patients with advanced stages (III or IV), are recognized to be heterogeneous, and greater latitude is acknowledged regarding treatment approaches. As a general rule, however, for stage IIIA and IIIB, chemoradiation is typically considered standard management with surgery recommended only in specialized settings. For patients with stage IV disease, chemotherapy is typically the recommended treatment, with surgery and radiation being utilized in highly selected circumstances.
Yet, despite these guidelines, a substantial proportion of NSCLC patients remain untreated, and the number of patients in the United States who undergo no treatment for NSCLC has remained fairly constant since the 1990s. Overall, the proportion of untreated NSCLC patients varies by stage, ranging from 7 – 45%, but in subsets of older, medically inoperable patients, the untreated population can reach as high as 90%.5–11 Significantly, untreated patients tend to be older, black, lack insurance and have lower income than patients who undergo treatment for NSCLC, underscoring the impact of socio-economic, racial, and other disparities in treatment decisions.6 Given the particularly poor survival among untreated NSCLC patients (reaching a nadir of approximately 7.2 months in the 1990s),12 we sought to characterize the patient and provider factors of untreated NSCLC patients in a hospital-based cohort. We hypothesized that patients who are older, poorly educated, without health insurance and having higher disease stage would have a higher likelihood of being untreated, but we also hypothesized that there are a substantial number of untreated patients who are statistically similar to patients who undergo treatment.
Methods
We queried the National Cancer Database (NCDB) for cases of biopsy-proven NSCLC from 1998 – 2012. The NCDB is a joint program of the Commission on Cancer (CoC) and the American Cancer Society (ACS). Data captured in the NCDB represent 1,500 CoC- accredited facilities and over 70% of all newly diagnosed cancer cases in the United States and are used to track treatments and outcomes as well as provide quality related performance measures.13 We abstracted data on key clinical/pathologic characteristics and analyzed the factors associated with patients’ untreated status. We used propensity matching to identify untreated patients who were not different from patients who underwent standard of care therapies.
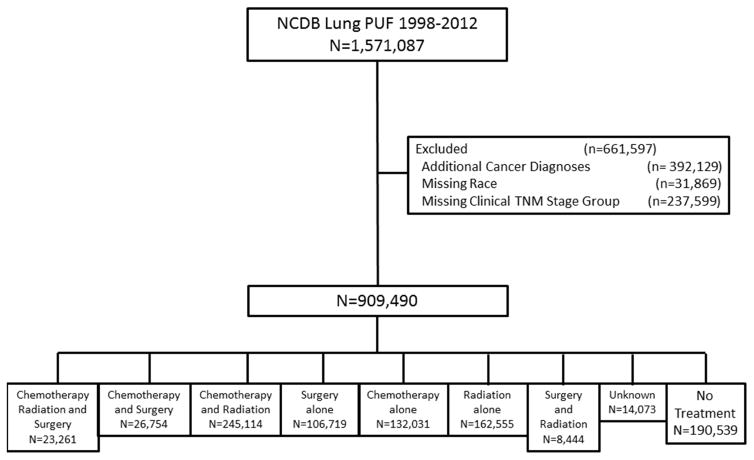
This study received a determination letter from the University of California, Davis Institutional Review Board. Data for patients with primary NSCLC were obtained from the NCDB participant user file for patients treated from 1998–2012. Patients with stage I–IV NSCLC with histologic data available were included. Patients with an additional cancer diagnosis were excluded. Inclusion and exclusion criteria are summarized in Figure 1.
Figure 1.
Study Population from the National Cancer Database Participant User File 1998–2012
Patient, tumor, and treatment data were extracted and categorized as appropriate. Surgical operations included wedge resection, sublobar resection, lobectomy, bilobectomy, and pneumonectomy. Patient comorbidities were assessed using the Charlson comorbidity index, described by Deyo et al14. Additional categorical variables examined included sex, race, income, education, insurance status, year of diagnosis, clinical stage group, clinical node status, histology, and treatment facility. Income categories were defined as follows: low <$38,000; middle >$38,000–47,999, and high >$48,000. Education categories were defined by the percent of patients who did not graduate from high school: low ≥13%; middle =7– to <13%, and high <7%. Continuous variables included age and tumor size. Continuous variables were compared using Kruskal-Wallis tests and categorical variables were compared using chi-square tests to determine differences in the treatment groups.
Types of treatment included chemotherapy, radiation, and surgery; chemotherapy and surgery; chemoradiation; surgery only; chemotherapy only; radiation only; surgery and radiation; unknown; and no treatment. The unknown treatment group included patients with missing data for chemotherapy, surgery or radiation; whereas the no treatment group included patients who did not have surgery, radiation or chemotherapy. Linear regression analysis was used to determine the trend in treatment over the study period, using the proportion of patients who received treatment at a certain year as a continuous variable as the outcome. Overall survival (OS) functions were estimated using Kaplan-Meier method within treatment groups. Log-rank tests were conducted to examine whether the unadjusted differences in OS between the treatment groups were statistically significant within each stage. The multivariable Cox proportional hazards model was used to study the association of each of the variables on OS.15 The multivariable logistic regression model was used to study the association of each of the variables with being untreated.
Propensity score matching was used to identify 2 similar groups of patients for the stages (stage IIIA and IV) where the proportion of untreated patients increased over the study period. Propensity score matching of patients with stage IIIA disease who were treated with chemoradiation vs no treatment was used to identify 2 comparable groups of patients.16 Similarly, propensity score matching of patients with stage IV disease who were treated with chemotherapy only vs. no treatment was used to identify 2 comparable groups. Patients in these analyses were matched for age, gender, race, income, education, clinical tumor size, clinical node status, Charlson/Deyo score, and facility type. P-values less than 0.05 were considered as statistically significant. All statistical analyses were conducted using SAS for Windows, version 9.4 (SAS Institute Cary, NC).
Results
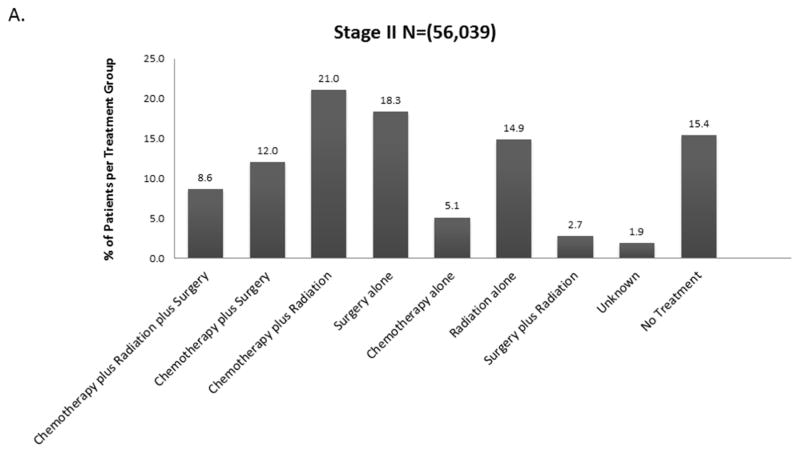
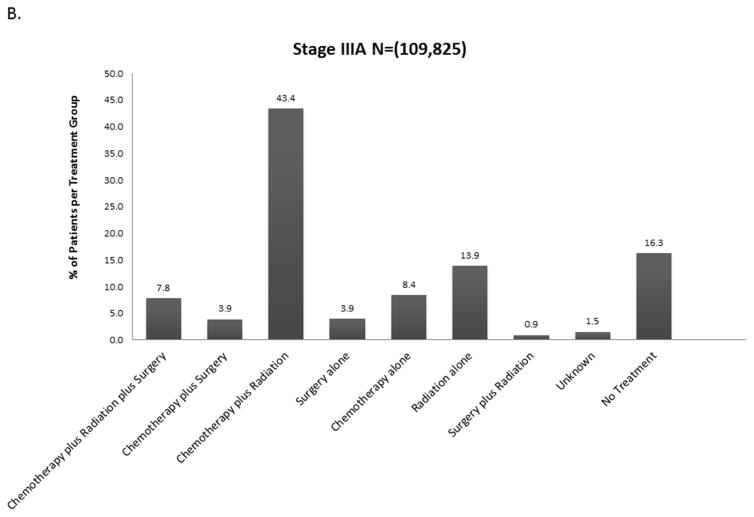
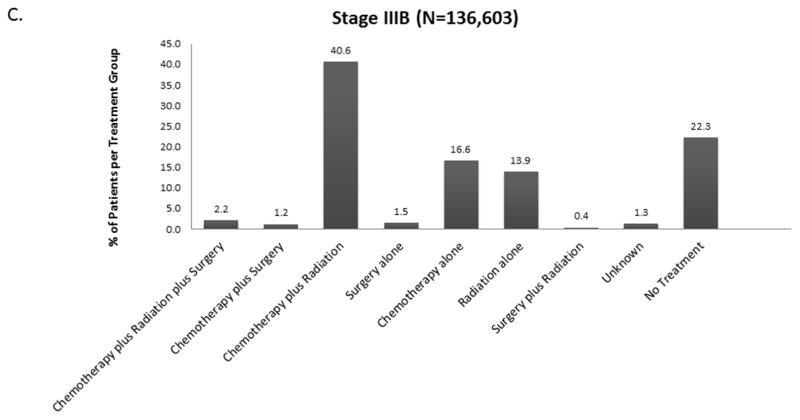
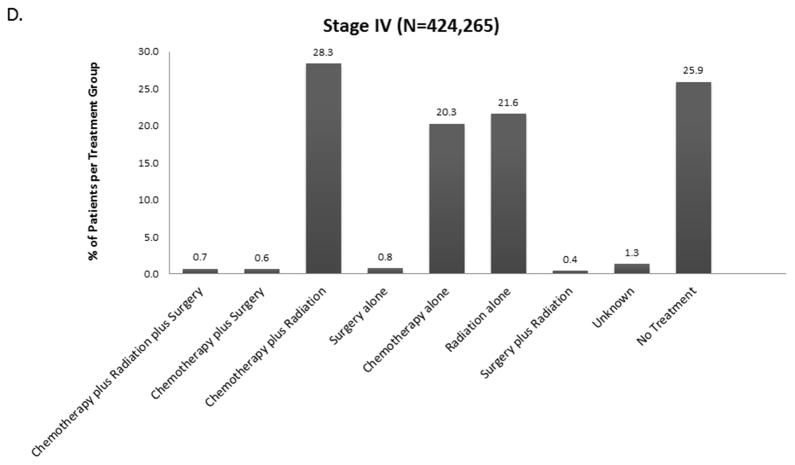
The distribution of treatment group by stage is shown in Figure 2 and eFigure 1. Overall, 21% (190,539) of patients received no treatment (by stage: I-13.5%, II-15.4%, IIIA – 16.5%, IIIB-22.2%, IV – 25.5%). For each stage, treatment groups varied significantly by age, Charlson-Deyo score, Sex, Race, Insurance Status, Income, Education, Year of Diagnosis, Facility Type, Histology, Tumor Size, and Clinical N Status (data not shown, but available upon request). Across all stages, untreated patients were more likely to be older and have Medicare insurance rather than private insurance.
Figure 2.
Distribution of Treatment Group by Stage A. Stage II B. Stage IIIA C. Stage IIIB D. Stage IV (Stage I available in Online Supplement eFigure 1).
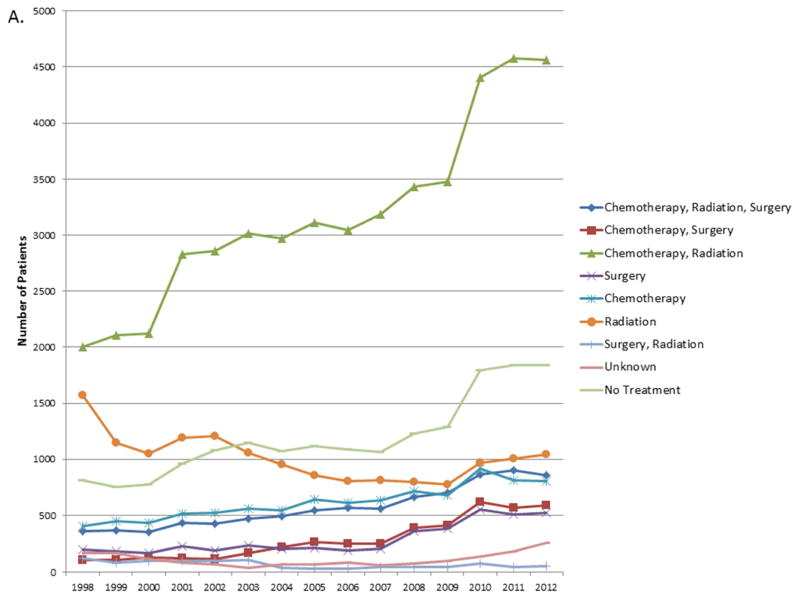
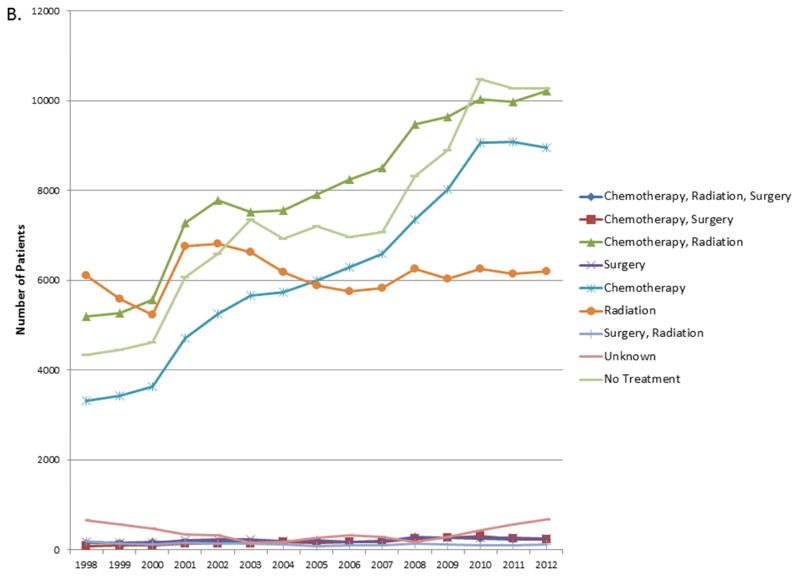
When considered as a continuous variable, the proportion of patients in each treatment group for each year was used to calculate the trends in changes in treatment patterns. The results are shown in Tables e1A–E. For stage I and II, the proportion of untreated patients decreased by 0.66% and 0.23% over the 14 year study period (p<0.0001, p= 0.022). For stage IIIA and IV, the proportion of untreated patients increased over the study period by 0.21% and 0.4% respectively (p= 0.003, <0.0001) (Figure 3). For stage IIIB there was no significant change in the proportion of untreated patients.
Figure 3.
A. Trends in number of patients in each treatment group for Stage IIIA. B. Trends in number of patients in each treatment group for Stage IV.
Factors associated with OS (available in online supplement, eTable 2) and receiving no treatment were analyzed and are shown in Table 1. A subset of the cohort with complete data was used for these analyses, secondary to missing and unavailable data within the NCDB PUF. Type of treatment, age, sex, race, insurance status, income, education, Charlson-Deyo score, year of diagnosis, clinical stage, tumor size, clinical nodal status, histology and type of treatment facility were all significantly associated with OS (p<0.0001). As expected, older age, female sex, non-white race, no insurance, low income, low education, higher Charlson-Deyo score, earlier year of diagnosis, higher clinical stage, larger tumor size, higher nodal status, were all significantly associated with receiving no treatment.
Table 1.
Multivariable logistic regression analysis for predictors of receiving No Treatment (N = 446,383)
| Odds Ratio Estimates | ||||
|---|---|---|---|---|
| Effect | Point Estimate | 95% Wald Confidence Limits | p-value | |
| Age | 1.053 | 1.052 | 1.054 | < 0.0001 |
| Sex | 0.0038 | |||
| Male vs. Female | 0.976 | 0.961 | 0.992 | |
| Race | < 0.0001 | |||
| Black vs. White | 1.245 | 1.214 | 1.277 | |
| Other vs. White | 1.337 | 1.184 | 1.509 | |
| Unknown vs. White | 1.538 | 1.415 | 1.671 | |
| Insurance Status | < 0.0001 | |||
| Unknown vs. Not Insured | 0.674 | 0.627 | 0.723 | |
| Medicaid vs. Not Insured | 0.784 | 0.746 | 0.825 | |
| Medicare vs. Not Insured | 0.504 | 0.482 | 0.526 | |
| Other Government vs. Not Insured | 0.466 | 0.428 | 0.508 | |
| Private Insurance vs. Not Insured | 0.453 | 0.433 | 0.473 | |
| Income | < 0.0001 | |||
| High vs. Low | 0.907 | 0.884 | 0.930 | |
| Middle vs. Low | 0.919 | 0.897 | 0.941 | |
| Education | < 0.0001 | |||
| High vs. Low | 0.827 | 0.807 | 0.847 | |
| Middle vs. Low | 0.885 | 0.866 | 0.904 | |
| Charlson-Deyo Score | < 0.0001 | |||
| 1 vs. 0 | 1.176 | 1.155 | 1.198 | |
| 2 vs. 0 | 1.582 | 1.546 | 1.620 | |
| Year of Diagnosis | 0.991 | 0.988 | 0.994 | < 0.0001 |
| Stage | < 0.0001 | |||
| II vs. I | 1.302 | 1.252 | 1.354 | |
| IIIA vs. I | 1.727 | 1.666 | 1.790 | |
| IIIB vs. I | 2.207 | 2.133 | 2.283 | |
| IV vs. I | 3.069 | 2.985 | 3.155 | |
| Histology | < 0.0001 | |||
| Other vs. Adenocarcinoma | 1.052 | 1.033 | 1.073 | |
| Squamous vs. Adenocarcinoma | 1.008 | 0.987 | 1.029 | |
| Facility Type | < 0.0001 | |||
| Academic/Research Program vs. Community Cancer Program | 0.772 | 0.752 | 0.793 | |
| Comprehensive Community Cancer Program vs. Community Cancer Program | 0.862 | 0.842 | 0.883 | |
| Other specified types of cancer programs vs. Community Cancer Program | 1.088 | 0.903 | 1.311 | |
| Tumor Size (mm) | 1.000 | 1.000 | 1.001 | < 0.0001 |
| Clinical N Status | < 0.0001 | |||
| cN1 vs. cN0 | 0.915 | 0.887 | 0.944 | |
| cN2 vs.CN0 | 0.934 | 0.912 | 0.957 | |
| cN3 vs. CN0 | 0.789 | 0.766 | 0.813 | |
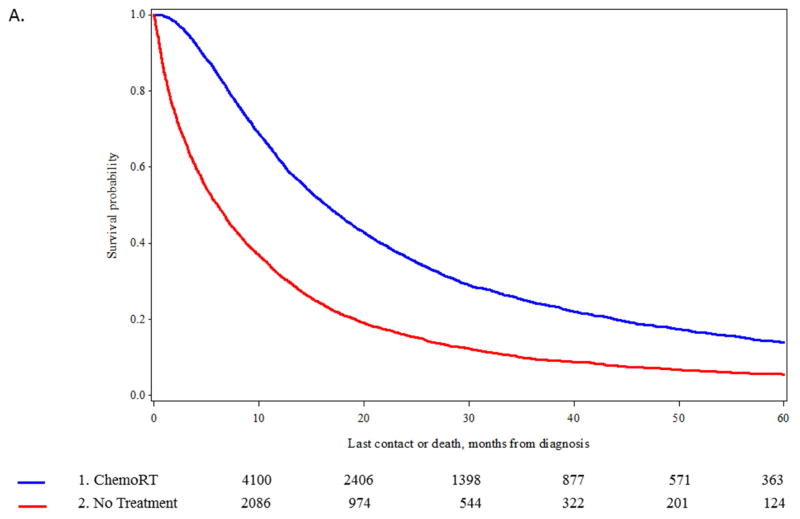
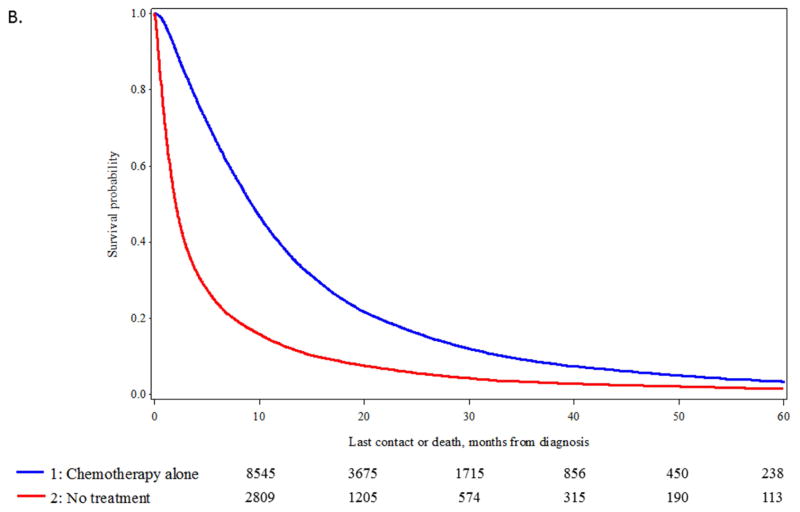
In the stages of disease where the number of untreated patients increased (stage IIIA and IV), propensity score matching was used to identify comparable groups of patients treated with standard of care approaches (chemotherapy and radiation for stage IIIA; chemotherapy only for stage IV) vs untreated patients. We were able to identify 6,144 matched pairs of patients with stage IIIA disease (eTable 3) and 19,046 matched pairs of stage IV patients (eTable 4) (data available online). Significant differences in OS were observed between the matched pairs. For stage IIIA disease, median OS was 16.5 vs 6.1 months, p <0.0001 (Figure 4A) and for stage IV median OS, 9.3 vs 2.0 months, p<0.0001 (Figure 4B).
Figure 4.
A. Kaplan-Meier curve for overall survival (OS) in patients at stage IIIA undergoing chemotherapy plus radiation versus no treatment after propensity score matching of 6,144 patient pairs (p-value of log-rank test < 0.0001). B. Kaplan-Meier curve for overall survival (OS) in patients at stage IV undergoing chemotherapy versus no treatment after propensity score matching of 19,046 patient pairs (p-value of log-rank test < 0.0001).
Discussion
It is unrealistic to expect that all patients with lung cancer will be candidates for and choose to undergo treatment for NSCLC, especially in advanced stage NSCLC. However, as novel therapies have been introduced which offer improved survival, there have also been improvements in supportive care and side effect management which have also improved patient tolerance of standard cytotoxic therapies such as chemotherapy, radiotherapy, and even surgery.17 Consequently, a plausible hypothesis would be that the number of untreated patients in advance stage NSCLC would decrease over time, as we observed for patients with stage I and II disease. However, using the NCDB hospital-based data set, we observed the opposite, namely there was significant increase in the prevalence of patients receiving no treatment in stage IIIA and IV disease. Among stage IIIA patients tracked in the California Cancer Registry, a similar trend was identified for increased numbers of patients being untreated between 2004–2012 (0.9%, p<0.001).9 Additionally, among stage IIIA, IIIB and IV patients there was a trend of significantly decreased use of multimodality regimens in the California Cancer Registry.
By employing a propensity matching analysis, we attempted to assess the number of untreated patients who were statistically similar to patients who received standard of care treatments as outlined in NCCN guidelines.4 We identified 8,457 untreated stage IIIA patients and we were able to match 73% (6,144) to comparable treated patients. Among the stage IV patients, we were able to match 55% (19,046) of the untreated cohort to patients who underwent chemotherapy. The substantial fraction of matched patients receiving no treatment is evidence that other factors besides selection bias are affecting decisions to forego treatment in advanced stage NSCLC.
There are many factors that influence the decision not to undergo treatment for NSCLC, including patient and disease characteristics, as well as physician factors. Wassener et al found that primary care physicians are less likely to refer patients with advanced NSCLC to an oncologist than patients with breast cancer.18 Similarly, Goulart et al observed that family practice physicians were less likely to refer advanced stage NSCLC patients to medical oncologists than general internists.19 Thus, it is possible that physician referral patterns and preferences influence treatment patterns and outcomes, as Goulart et al also found that practice patterns influenced the delivery of guideline-based therapy. It should also be noted that patient factors likely influence physician referral patterns as well, such as rural location and insurance status which may not only limit options for care but also raise barriers to receiving treatment.
Socioeconomic disparities are strongly linked with differences in treatment and poor outcomes for NSCLC. Berglund et al identified a decreased likelihood of treatment with chemotherapy for advanced stage NSCLC patients as economic status declined (p<0.01) and as age (p<0.01) and comorbidities increased (p<0.01).20 Among the patients in the highest quintile of economic status, survival was the longest. Racial differences in rates of surgery between black and white patients in the Surveillance, Epidemiology and End Results (SEER) Program have also been identified, and an analysis of SEER data suggests that an additional 44 lives could have been saved if surgery had been used equally along racial lines for early-stage NSCLC.21 Insurance status also significantly impacts treatment decisions. Groth et al found that stage I NSCLC patients with private insurance were more likely to undergo treatment with lobectomy than patients with Medicare, Medicaid or no insurance (p not specified).22 Similarly, geographic factors have been associated with oncologic outcomes. For example, Johnson et al found that rural NSCLC patients in Georgia were more likely to have unstaged disease (OR=1.63, 95% CI: 1.45–1.83) and less likely to receive radiation (OR=0.89, 95% CI: 0.82–0.96) or chemotherapy (OR=0.92, 95% CI: 0.85–0.99) than urban patients.23
In our analysis, older patients were also less likely to undergo treatment, and previous studies have suggested that this contributes to marked survival disparities. An analysis by Nanda et al. using the NCDB evaluated patients over the age of 70 with early stage NSCLC and compared outcomes between stereotactic radiotherapy (SBRT) and no treatment.10 Despite similar Charlson-Deyo scores, untreated patients had a median survival of 10.1 months, compared to 29 months following SBRT (p<0.001). This survival benefit to SBRT was consistently observed across all age groups, including those patients age 85 and over, suggesting that a substantial proportion of older patients may be undertreated.
Nevertheless, it is important to consider our analysis within the context of its strengths and limitations. The large sample size in the NCDB allows for identification of patterns of treatment, but it does not allow for a granular assessment of individual subsets of patients. Despite our attempts to create distinct subsets of patients, it is not possible to fully account for the heterogeneity seen within each stage for patients with NSCLC using an administrative dataset. Additionally, we are unable to assess the extent of multidisciplinary evaluation or the role of a tumor board in treatment decisions using this dataset, which would enhance our analysis.
Ultimately, our analysis could be interpreted as yet another manuscript demonstrating a selection bias for treated patients. However, it is important to underscore the significant numbers of untreated patients who were able to be matched with treated patients in both stage IIIA or IV NSCLC. This identifies a potentially notable area for improvement in order to develop innovative ways to improve access to care for higher stage NSCLC patients, especially those from lower socioeconomic status, lower education, lower income and nonprivate insured groups. Future studies will need to investigate additional factors which influence treatment decisions for NSCLC patients including: regional treatment variations, proximity to treatment, and presence of regional treatment resources; as these may all be areas which can be improved with targeted interventions to overcome barriers to treatment.
Conclusion
Substantial numbers of patients remain untreated for NSCLC in the United States, but high percentages of these patients are statistically similar to treated patients when compared by age, sex, race, income, education, tumor size, nodal status, Charlson-Deyo score, and treatment facility type. Physicians should endeavor to ensure that patients from disparate populations are evaluated and counseled thoroughly by multidisciplinary teams before choosing to forego treatment for NSCLC.
Supplementary Material
Figure e1. Distribution of Treatment Group by Stage I
Acknowledgments
Funding sources: The project described was supported by the National Center for Advancing Translational Sciences, National Institutes of Health, through grant number UL1 TR000002. The content is solely the responsibility of the authors and does not necessarily represent the official views of the NIH.
This work was directly supported by the Department of Surgery Outcomes Research Group.
Elizabeth David, Chin-Shang Li, and Robert Canter had full access to all the data in the study and take responsibility for the integrity of the data and the accuracy of the data analysis
Footnotes
DISCLOSURES: None.
Publisher's Disclaimer: This is a PDF file of an unedited manuscript that has been accepted for publication. As a service to our customers we are providing this early version of the manuscript. The manuscript will undergo copyediting, typesetting, and review of the resulting proof before it is published in its final citable form. Please note that during the production process errors may be discovered which could affect the content, and all legal disclaimers that apply to the journal pertain.
References
- 1.American Cancer Society. Cancer Fact and Figures. 2014 http://www.cancer.org/acs/groups/content/@research/documents/webcontent/acspc-042151.pdf.
- 2. [Accessed January 7, 2016];SEER Stat Fact Sheets: Lung and Bronchus Cancer. http://seer.cancer.gov/statfacts/html/lungb.html. Published 2015.
- 3.Wakelee Ha, Bernardo P, Johnson DH, Schiller JH. Changes in the natural history of nonsmall cell lung cancer (NSCLC)--comparison of outcomes and characteristics in patients with advanced NSCLC entered in Eastern Cooperative Oncology Group trials before and after 1990. Cancer. 2006;106(10):2208–2217. doi: 10.1002/cncr.21869. [DOI] [PubMed] [Google Scholar]
- 4. [Accessed January 1, 2016];NCCN Guidelines for NSCLC. http://www.nccn.org/professionals/physician_gls/pdf/nscl.pdf.
- 5.Smith TJ, Penberthy L, Desch CE, et al. Differences in initial treatment patterns and outcomes of lung cancer in the elderly. Lung Cancer. 1995;13(3):235–252. doi: 10.1016/0169-5002(95)00496-3. [DOI] [PubMed] [Google Scholar]
- 6.Small AC, Tsao C-K, Moshier EL, et al. Prevalence and characteristics of patients with metastatic cancer who receive no anticancer therapy. Cancer. 2012;118(23):5947–5954. doi: 10.1002/cncr.27658. [DOI] [PubMed] [Google Scholar]
- 7.Raz DJ, Zell JA, Ou SHI, Gandara DR, Anton-Culver H, Jablons DM. Natural history of stage I non-small cell lung cancer: Implications for early detection. Chest. 2007;132(1):193–199. doi: 10.1378/chest.06-3096. [DOI] [PubMed] [Google Scholar]
- 8.Yang P, Allen MS, Aubry MC, et al. Clinical features of 5,628 primary lung cancer patients: Experience at Mayo Clinic from 1997 to 2003. Chest. 2005;128(1):452–462. doi: 10.1378/chest.128.1.452. [DOI] [PubMed] [Google Scholar]
- 9.David EA, Canter RJ, Chen Y, Cooke DT, Cress R. Surgical Management of Advanced Stage NSCLC is Decreasing but Remains Associated with Improved Survival. Ann Thorac Surg. 2016 doi: 10.1016/j.athoracsur.2016.04.058. [DOI] [PMC free article] [PubMed] [Google Scholar]
- 10.Nanda RH, Liu Y, Gillespie TW, et al. Stereotactic body radiation therapy versus no treatment for early stage non-small cell lung cancer in medically inoperable elderly patients: A National Cancer Data Base analysis. Cancer. 2015;121(23):4222–4230. doi: 10.1002/cncr.29640. [DOI] [PubMed] [Google Scholar]
- 11.Brule SY, Al-Baimani K, Jonker H, et al. Palliative systemic therapy for advanced non-small cell lung cancer: Investigating disparities between patients who are treated versus those who are not. Lung Cancer. 2016;97:15–21. doi: 10.1016/j.lungcan.2016.04.007. [DOI] [PubMed] [Google Scholar]
- 12.Wao H, Mhaskar R, Kumar A, Miladinovic B, Djulbegovic B. Survival of patients with non-small cell lung cancer without treatment: a systematic review and meta-analysis. Syst Rev. 2013;2(1):10. doi: 10.1186/2046-4053-2-10. [DOI] [PMC free article] [PubMed] [Google Scholar]
- 13.Bilimoria K, Stewart A, Winchester D, Ko C. The National Cancer Data Base: A Powerful Initiative to Improve Cancer Care in the United States. Ann Surg Oncol. 2008;15(3):683–690. doi: 10.1245/s10434-007-9747-3. [DOI] [PMC free article] [PubMed] [Google Scholar]
- 14.Deyo RA, Cherkin DC, Ciol MA. Adapting a clinical comorbidity index for use with ICD-9-CM administrative databases. J Clin Epidemiol. 1992;45(6):613–619. doi: 10.1016/0895-4356(92)90133-8. [DOI] [PubMed] [Google Scholar]
- 15.Cox D. Regression Models and Life-Tables Authors (s): D.R. Cox Source: Journal of the Royal Statistical Society. Series B (Methodological), Vol. 34, No. 2 Published by: Wiley for the Royal Statistical Society Stable. J R Stat Soc. 1972;34(2):187–220. http://www.jstor.org/stable. [Google Scholar]
- 16.Ho D, Kosuke I, King G, Stuart E. MatchIt: Nonparametric preprocessing for parametric causal inference. Polit Anal. 2007;15(3):199–236. [Google Scholar]
- 17.Coate LE, Shepherd Fa. Maintenance therapy in advanced non-small cell lung cancer: evolution, tolerability and outcomes. Ther Adv Med Oncol. 2011;3(3):139–157. doi: 10.1177/1758834011399306. [DOI] [PMC free article] [PubMed] [Google Scholar]
- 18.Wassenaar TR, Eickhoff JC, Jarzemsky DR, Smith SS, Larson ML, Schiller JH. Differences in primary care clinicians’ approach to non-small cell lung cancer patients compared with breast cancer. J Thorac Oncol. 2007;2(8):722–728. doi: 10.1097/JTO.0b013e3180cc2599. [DOI] [PubMed] [Google Scholar]
- 19.Goulart BHL, Reyes CM, Fedorenko CR, et al. Referral and Treatment Patterns Among Patients With Stages III and IV Non–Small-Cell Lung Cancer. J Oncol Pract. 2013;9(1):42–50. doi: 10.1200/JOP.2012.000640. [DOI] [PMC free article] [PubMed] [Google Scholar]
- 20.Berglund a, Lambe M, Luchtenborg M, et al. Social differences in lung cancer management and survival in South East England: a cohort study. BMJ Open. 2012;2(3):e001048–e001048. doi: 10.1136/bmjopen-2012-001048. [DOI] [PMC free article] [PubMed] [Google Scholar]
- 21.Bach PB, Cramer LD, Warren JLBC. Racial Differences in the Treatment of Early-Stage Lung Cancer. N Engl J Med. 1999;341(16):1198–1205. doi: 10.1056/NEJM199910143411606. [DOI] [PubMed] [Google Scholar]
- 22.Groth SS, Al-Refaie WB, Zhong W, et al. Effect of insurance status on the surgical treatment of early-stage non-small cell lung cancer. Ann Thorac Surg. 2013;95(4):1221–1226. doi: 10.1016/j.athoracsur.2012.10.079. [DOI] [PubMed] [Google Scholar]
- 23.Johnson AM, Hines RB, Johnson JA, Bayakly aR. Treatment and survival disparities in lung cancer: the effect of social environment and place of residence. Lung Cancer. 2014;83(3):401–407. doi: 10.1016/j.lungcan.2014.01.008. [DOI] [PubMed] [Google Scholar]
Associated Data
This section collects any data citations, data availability statements, or supplementary materials included in this article.
Supplementary Materials
Figure e1. Distribution of Treatment Group by Stage I


