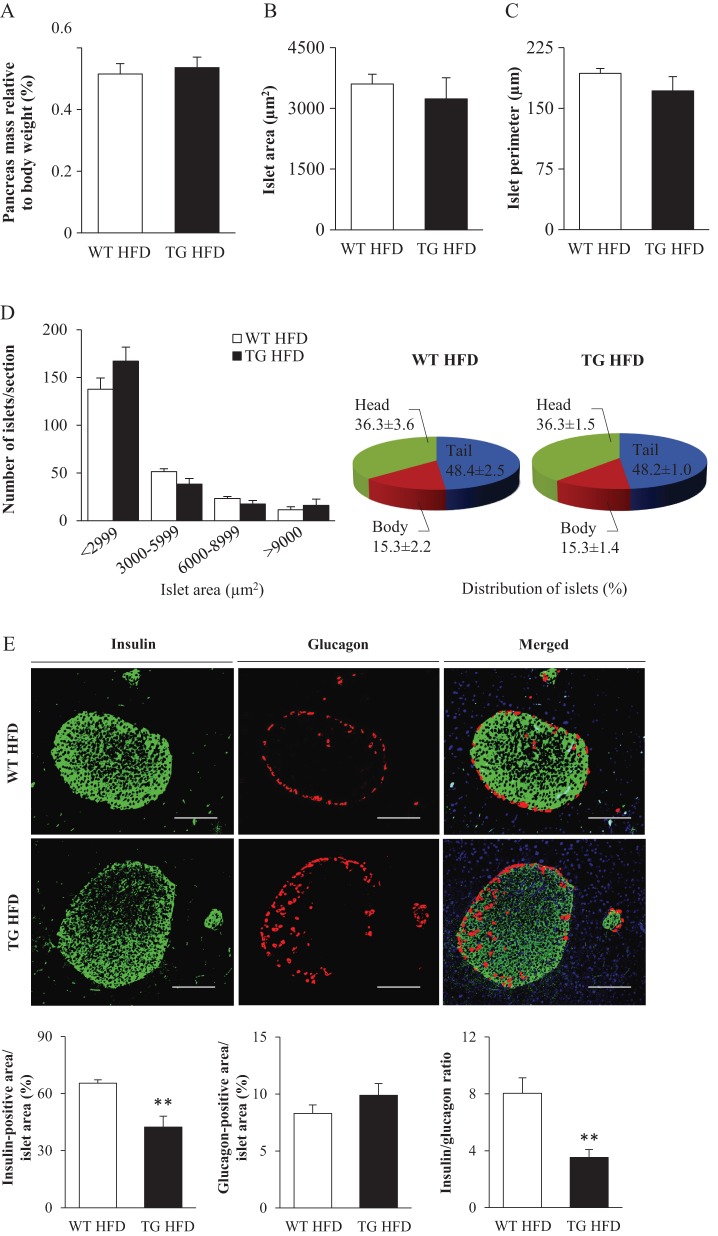
Figure 1.
Morphological analysis of pancreatic islets and their cellular composition in high-fat-fed Stk25 transgenic and wild-type mice. (A) Pancreatic weight. (B–D) The mean area of islets (B), islet perimeter (C) and islet area and regional distribution (D). (E) Representative immunofluorescence images double stained with antibodies for insulin (green) and glucagon (red). Nuclei stained with DAPI are shown in blue in a merged image. Scale bars, 50 µm. Quantification of insulin- and glucagon-positive area, and the islet β/α-cell ratio. Data are mean ± s.e.m. from 5 mice/genotype. **P < 0.01. HFD, high-fat diet; TG, transgenic; WT, wild-type.

 This work is licensed under a