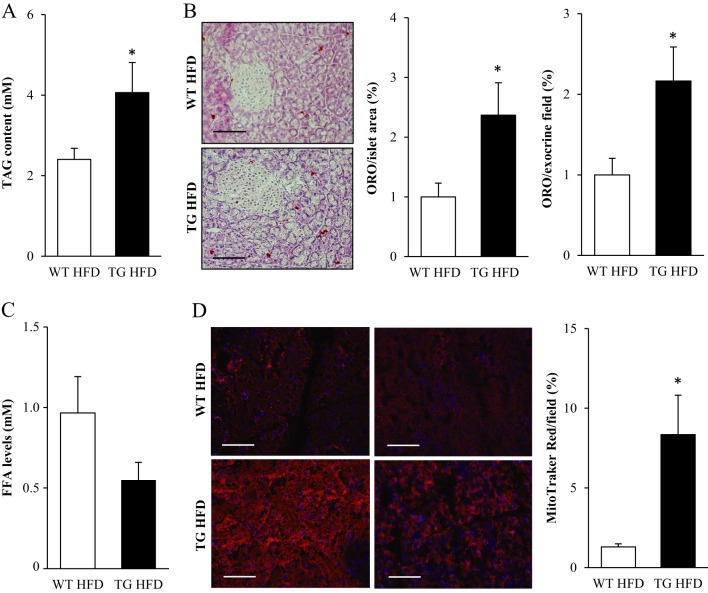
Figure 3.
Assessment of fat accumulation and mitochondrial activity in the pancreas of high-fat-fed Stk25 transgenic and wild-type mice. (A) Triacylglycerol content in pancreatic extracts. (B) Representative images stained with Oil Red O for lipids and counterstained with hematoxylin. Scale bars, 25 µm. Quantification of Oil Red O staining. (C) Free fatty acid levels in pancreatic extracts. (D) Representative images stained with MitoTracker Red; nuclei stained with DAPI (blue). Scale bars, 25 µm. Quantification of MitoTracker Red staining. For A and C, data are mean ± s.e.m. from 11 to 12 mice/genotype; for B and D, data are mean ± s.e.m. from 5–7 mice/genotype. *P < 0.05. FFA, free fatty acid; HFD, high-fat diet; ORO, Oil Red O; TAG, triacylglycerol; TG, transgenic; WT, wild-type.

 This work is licensed under a