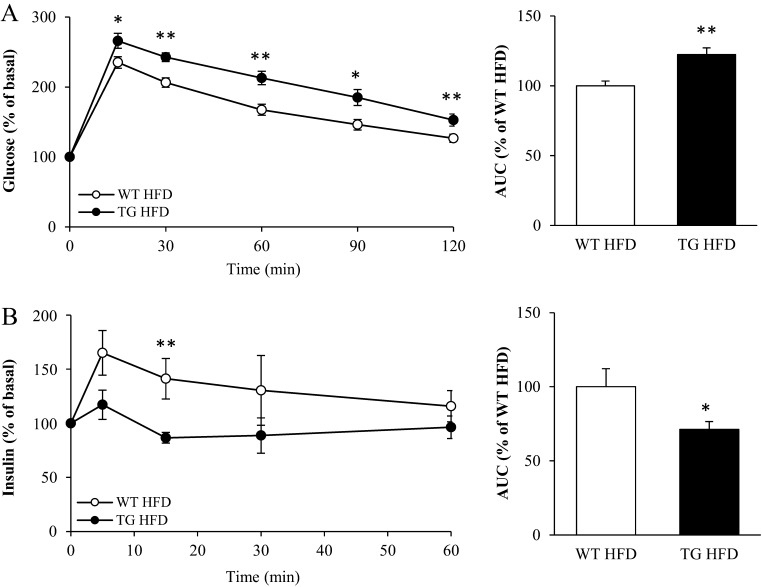
Figure 6.
In vivo glucose tolerance and glucose-stimulated insulin secretion in high-fat-fed Stk25 transgenic and wild-type mice. (A) Changes in blood glucose levels following an intraperitoneal injection of glucose. (B) Changes in plasma insulin levels during the experiment shown in (A). Data are mean ± s.e.m. from 9 to 10 mice/genotype. *P ≤ 0.05; **P < 0.01. HFD, high-fat diet; TG, transgenic; WT, wild-type.

 This work is licensed under a