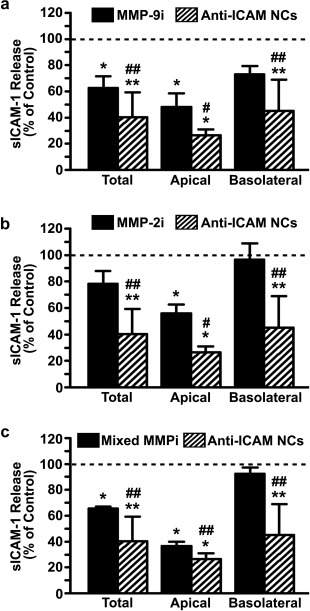
Figure 5.

Comparative reduction of sICAM‐1 by anti‐ICAM NCs versus MMP inhibitors. Reduction in sICAM‐1 release by TNFα‐activated HUVECs grown on transwell inserts and incubated for 30 min with MMP inhibitors (MMP‐9i (a), MMP‐2i (b), or a mixture of both [Mixed MMPi] (c)) or with anti‐ICAM NCs. Data show sICAM‐1 release as a percentage of controls (absence of inhibitors and NCs; horizontal dashed line). Data are mean ± SEM. *Comparison to control; #comparison between anti‐ICAM NCs and inhibitors (one symbol is p < 0.1 by Student's t‐test and two symbols is p < 0.1 by Mann‐Whitney Rank Sum test)
