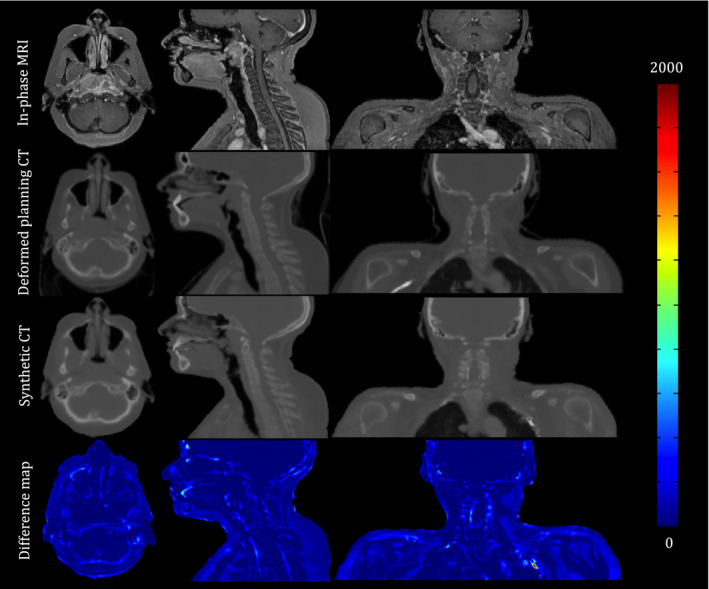
Figure 6.

An axial, coronal, and sagittal snapshot of the In‐phase MRI, deformed planning CT and synthetic CT generated using our proposed approach for patient #10. The color‐coded images are the absolute difference maps between the synthetic CT and deformed planning CT. Most differences are seen in the vicinity of the air‐bone and air‐soft tissue interfaces. [Color figure can be viewed at wileyonlinelibrary.com]
