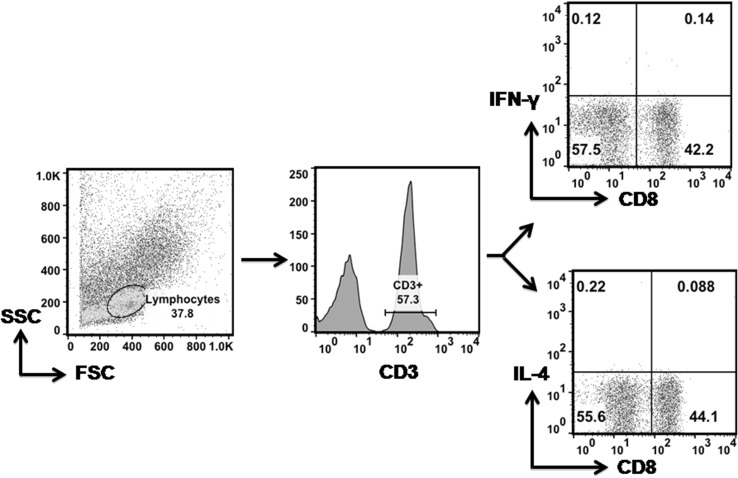
Fig. 1.
Gating strategy for defining IFN-γ and IL-4 producing CD4+ and CD8+ T cells. Left panel represents scatter profile of PBMCs gated on lymphocytes with forward scatter (FSC) on x-axis and side scatter (SSC) on y-axis. Lymphocytes stained with fluorescently conjugated anti-CD3 PECy5 and CD8 ECD were gated on CD3+ T cells as shown in a histogram (middle panel). The CD3+ T cells were further gated on CD8+ T cell subset and CD8- population was taken as CD4+ (right panel). Dot plots show CD4+ IFN-γ+ and CD8+ IFN-γ+ population (top right panel) and CD4+ IL-4+ subset (bottom right panel). The CD8 T cell subset producing IL-4 was negligible

