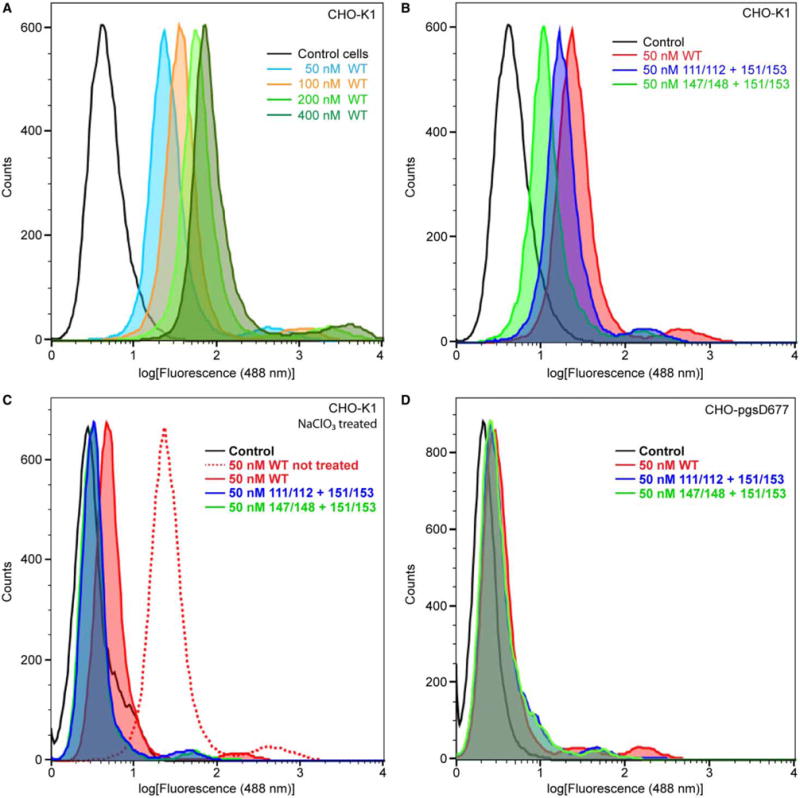
Figure 5. FACS analysis of Grem2 WT and lysine-to-alanine mutants.

FACS sorting graphs based on fluorescence at 488 nm. Graphs show the log of the MFI of cells treated with Grem2 WT or select lysine-to-alanine mutants. (A) CHO-K1 treated with varying concentrations of Grem2 WT. (B) CHO-K1 cells treated with 50 nM Grem2 WT or select lysine-to-alanine mutants. (C) CHO-K1 cells treated with NaClO3 prior to protein treatment. (D) CHO-pgsD-677 cells, which are deficient in their ability to produce heparin/HS precursors, treated with various Grem2 proteins.
