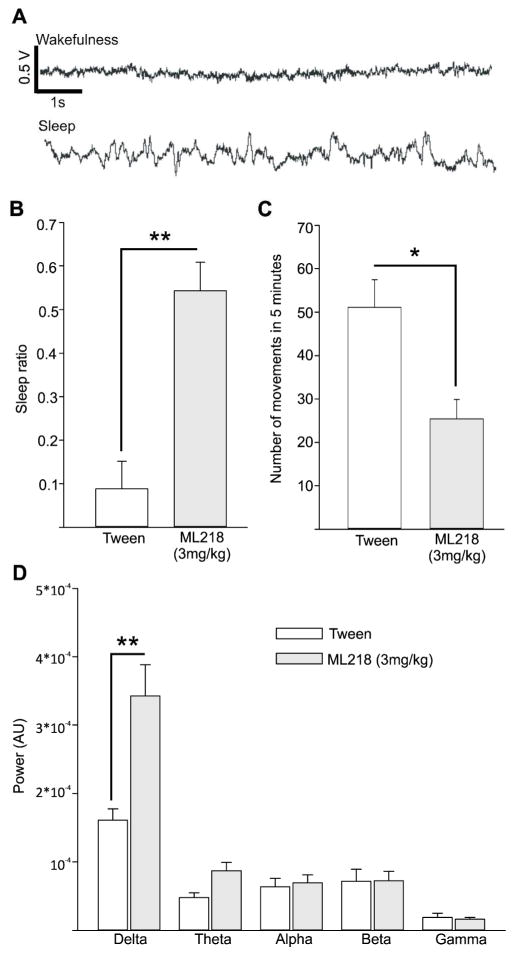
Figure 6. Results of ECoG recordings.
A, example of 10 second epoch of M1 ECoG recording representing wakefulness and sleep. The scale bars in the top trace also apply for the bottom trace. Positive changes in voltage are upward. B, proportion of sleep epoch among all epochs (‘Sleep ratio’) obtained in the 2 hour period following the injection of Tween (white) and ML218 (grey). C, number of spontaneous movements in 5 minute epochs (out of 15 minute time blocks) obtained during 2 hours following the injections. D, spectral power of the ECoG signals, integrated across the 5 frequency bands (delta, theta, alpha beta, gamma). Values are means + SEM. The differences between ML218 and vehicle injection sessions were assessed with a Mann-Whitney test. *, p<0.05; **, p<0.01.

