
Figure 4. Treadmill Software.
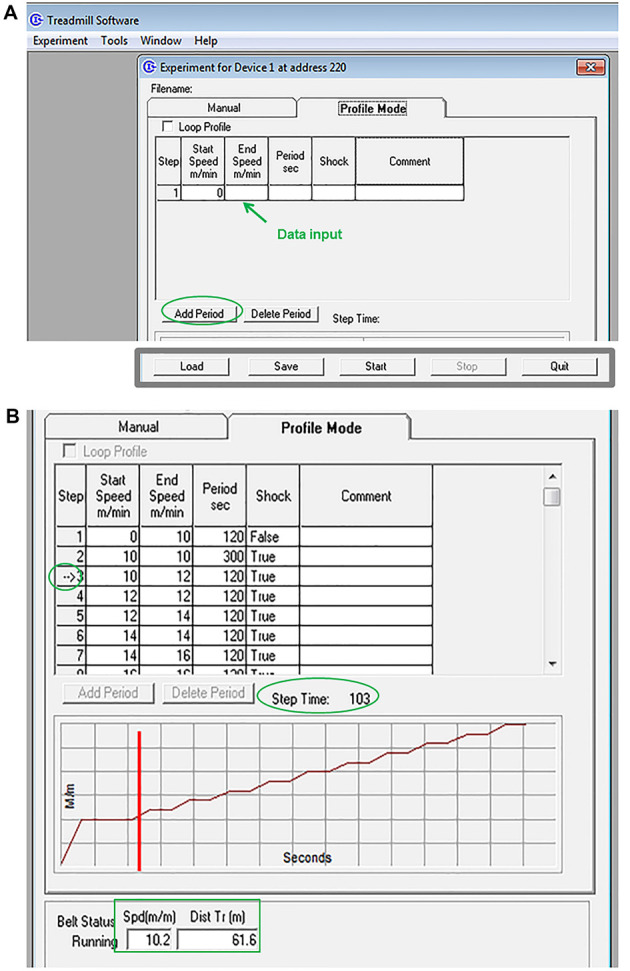
A. Creating a profile. A Treadmill exercise profile is created by selecting the text (white) boxes with the computer mouse and manually entering the corresponding parameters; more steps are added by clicking ‘add period’. This profile can be saved and used later to test other mice. To do this, click ‘Load’ in the profile mode screen and select the saved file. B. Running the experiment. A graphical representation is automatically generated to show the relative speed and time of the entire profile. The vertical red bar in the graph points out the current position, while an arrow within the step column of the profile table marks the step currently in use. Step time: informs about the time remaining within the current step; Spd (m/m): reports the current speed of the treadmill belt; Dist Tr (m): reports the total distance the treadmill belt has moved.