
Figure 4.
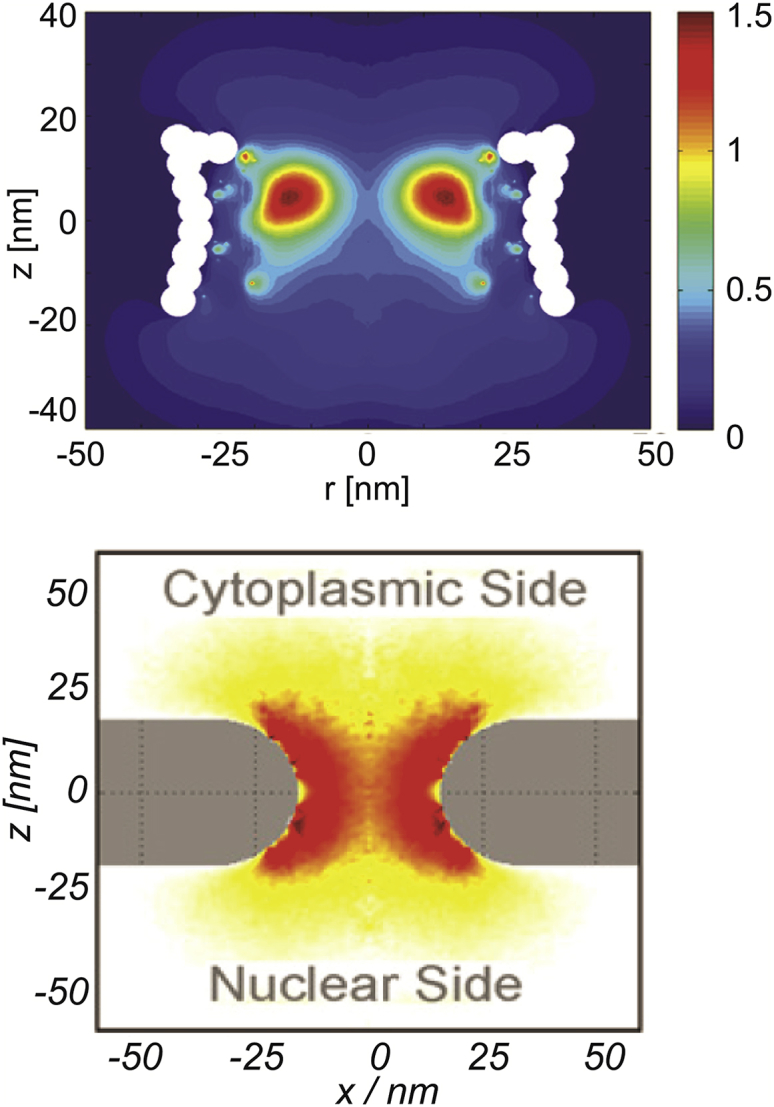
Given here are computational models of FG nup distribution within the NPC passageway. Upper and lower panels show the results of two different computational models of the FG nup distribution within the NPC passageway, reproduced from Ghavami et al. (57) and Tagliazucchi et al. (39), respectively. Each panel shows the vertical cross-section of the FG nup density distribution within the NPC passageway; red indicates higher local density. The results in the upper panel are obtained using Brownian dynamics simulations; the results in the lower panel are based on the density functional theory. Although using different parameterizations and computational techniques, the models agree in the qualitative predictions of the FG nup density distribution, which also agrees with the more coarse-grained models (50, 60). To see this figure in color, go online.