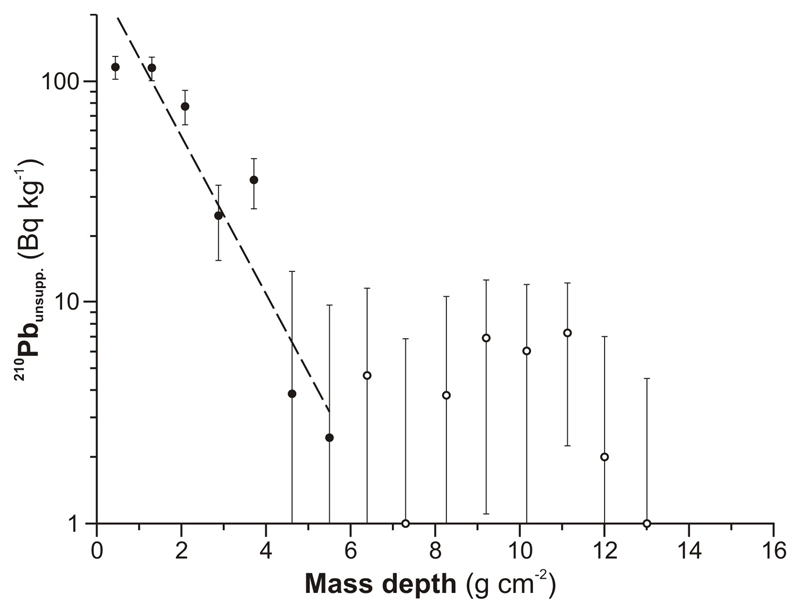
Extended Data Figure 3. Constant rate of supply (CRS) modelling of the down-core 210Pbxs profile on the outer Amundsen Sea shelf.
The CRS modelling was conducted on the sediments from core PS69/251 using a modified method56. The dashed line marks the regression used to calculate the 210Pb concentration below 6 cm core depth. Open circles highlight samples with 210Pbxs concentrations at or below the detection limit. Error bars denote 1 s.d. of the 210Pbxs concentrations.

