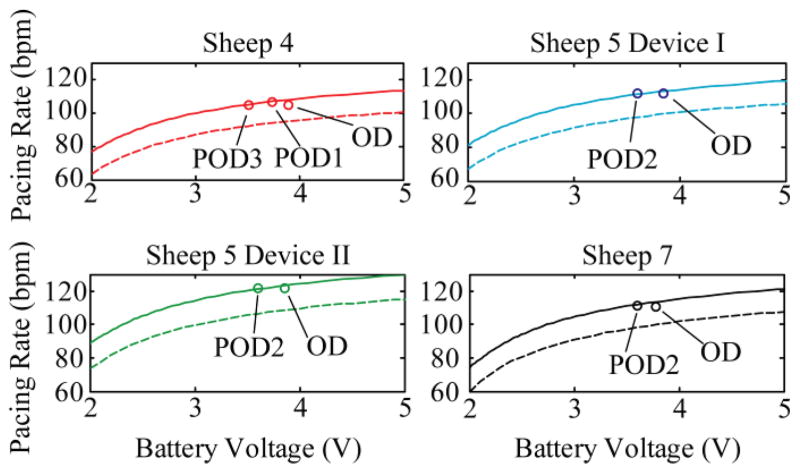
Fig. 11.
Corrected calibration curves. Calibrations (dotted lines) for different devices were linearly shifted (solid lines) to predict a new calibration for an in vivo environment. Data points taken during in vivo testing are plotted (circles), indicating the quality of the prediction. Full effect of the in vivo scenario was not complete on the first day (operational day, OD), hence the offset of the actual value from the prediction.

