
Figure 2. Mossy cells are more active than GCs in vivo.
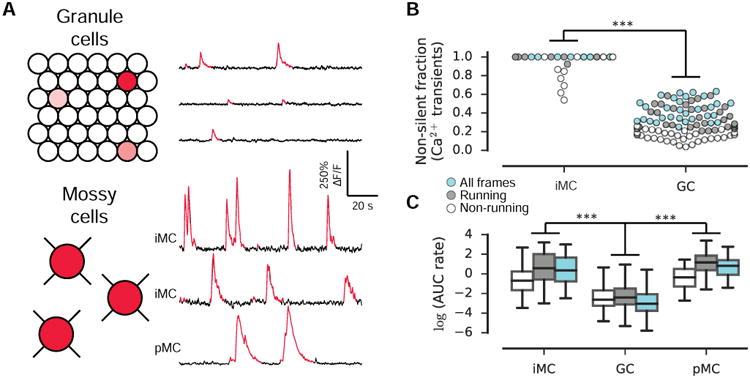
(A) Schematic of GC and MC activity. Only a small fraction of GCs are active (red shading) relative to MCs, and active MCs exhibit a significantly higher rate of Ca2+ activity than active GCs. (right) Ca2+ traces from 3 example active GCs (top) and 3 example MCs. Significant Ca2+ transients (p<0.05) are red.
(B) Activity was assessed by the rate of area under significant transients. The fraction of cells exhibiting non-zero activity is shown. Each circle represents a single recording session (with a minimum of 3 recorded cells) and is colored by the frames included in the analysis (non-running, running, and all frames). iMCs were significantly more active than GCs (F(1, 144)=1,510, p<0.001, two-way ANOVA). pMCs were not included in this analysis.
(C) The activity of non-silent cells within each condition (non-running, running, all) is shown. Non-silent iMCs were significantly more active than non-silent GCs (F(1, 12,588)=740, p<0.001, two-way ANOVA). Similarly, the activity of pMCs was significantly higher than GCs (F(1, 12,453) = 345, p < 0.001, two-way ANOVA).