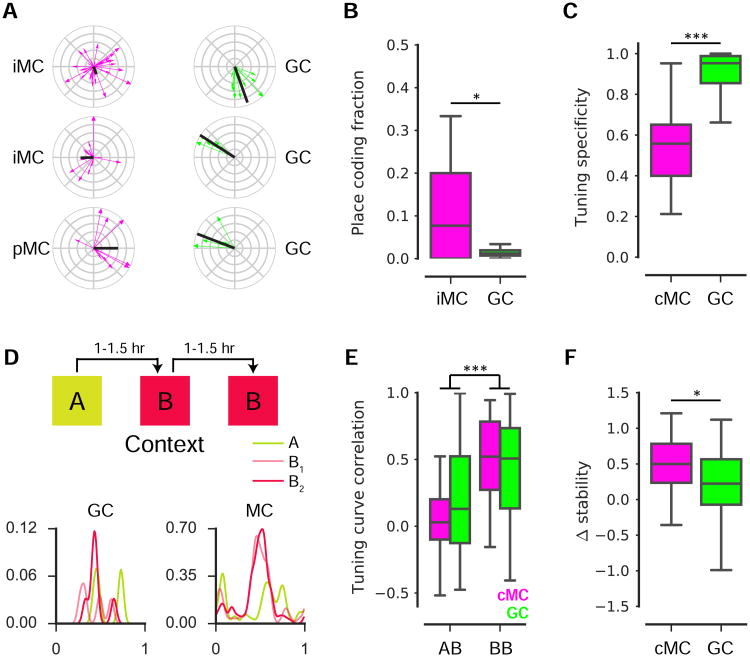
Figure 3. Spatial coding features of mossy cells.
(A) Spatial tuning plots for 3 example GCs and MCs identified as spatially-tuned. Each running-related transient is represented as a vector (direction, position at onset; magnitude, inverse of occupancy), and the complex sum of these vectors forms the tuning vector (black).
(B) The fraction of cells identified as spatially-tuned (≥4 Ca2+ transients, spatial information p-value < 0.05) within GC and iMC recording sessions. A higher fraction of MCs were spatially-tuned than of GCs across recording sessions (U(48)=183, p=0.017, Mann Whitney U).
(C) Among cells identified as spatially-tuned, cMCs exhibited a significantly lower tuning specificity than GCs (U(282)=836, p<0.001, Mann Whitney U).
(D) (top) Experimental schematic. Mice ran on a treadmill for randomly administered water rewards during three 12 min sessions in multisensory contexts ‘A’ and ‘B’. Contexts differed in auditory, visual, olfactory, and tactile cues, and sessions were separated by 60–90 min. (bottom) Spatial tuning curves are shown for an example GC and MC.
(E) The 1D correlation in spatial rate maps for GCs and cMCs were correlated in the ‘A-B’ and‘B-B’ conditions. For a cell to be included, it was required to be active and spatially-tuned in at least one of the two sessions being compared. Both populations exhibited a higher correlationin ‘B-B’ than ‘A-B’ (F(1, 355)=40.3, p<0.001, two-way ANOVA).
(F) To calculate the Δstability, we examined the subset of cells satisfying the inclusion criterion for both conditions. The Δstability was significantly higher for cMCs than GCs (U(88)=211, p=0.016, Mann Whitney U).

